I've just been asked by a client whether he should switch from cash to equities. Here's my view, and it may explain why I haven't earned much from investments over the last few years:
It is not possible to predict the market with any accuracy, but I think I have done well in foretelling the current state of affairs as early as the late 1990s. The market has dropped to half its 1999 peak (again, as it did in 2003), but that is not to say we are now at the bottom. Some (and I am moderately persuaded to this view) think that there may be a "bear market rally" soon-ish - maybe a rise that recovers perhaps 50% of the losses so far - but it is perfectly possible that the underlying trend is still downwards, so there may then be a horrid lurch towards - what? Maybe, ultimately, 4,000 on the Dow and 2,000 on the FTSE.
We are in the middle of an exciting ride and I fear that entering the market at this stage may still be for the adventurous and nimble. Yes, had one invested in mid-2003 and got out, say, late 2007, it would have turned a nice profit; but much depends on the entry and exit points. So as ever, attitude to risk and corresponding watchfulness are key factors.
There is also the question of what asset class to choose. I think domestic and commercial property are still overvalued, relative to income; because of fears regarding other assets, and also because of central bank investment ("quantitative easing" etc) government bonds are very highly priced, which is why the yields are so low (and if interest rates rise, bond values could then drop sharply); equities are depressed, but as dividends decline in very testing economic conditions, they may ultimately be depressed still further. Commodities (e.g. gold, silver, oil) are the subject of some speculation, but owing to shortage of borrowed money to invest with, not quite so much institutional speculation as formerly; even so, gold (for instance) is a bit above its long-term inflation-adjusted average, as far as I can tell - though if inflation takes off, the price could indeed escalate.
And then there is the question of currencies. The pound has lost heavily against the dollar; but some say the dollar may catch us up again. The Euro may also not stay as strong as it is now - several countries within the Eurozone are suffering economic problems and are hampered by the common currency; I have even read speculation that the Euro system may fall apart within a decade, or some states may secede from it.
In short, I still urge caution, and if you do decide to get in, be prepared to move quickly if the market should turn. Meantime, there are relatively safe options such as National Savings Certificates, including the index-linked ones that will at least keep the value of your savings roughly in line with RPI...
Showing posts with label Dow. Show all posts
Showing posts with label Dow. Show all posts
Friday, March 06, 2009
Thursday, March 05, 2009
Dow 4,500 within 12 months - Cederholm
Fred Cederholm gives a Dow target close to the one I'm thinking, though I think we may have a reality-denying rally before then, so I don't necessarily agree with his timescale.
Monday, March 02, 2009
Dow 6,000 this year, FTSE 3,000 - Nadeem Walayat
Sez he, here. I'm still guessing Dow (inflation-adjusted) 4,000 sometime in the next few years, and it seems Jim Kunstler agrees ("I myself called for Dow 4000 two years ago") In which case, maybe FTSE 2,000 at some point, too.
Saturday, February 28, 2009
The One Percenters
 The "real Dow", i.e. nominal value divided by the CPI inflation index, was about 14.6 in October 1928 and is now at c. 33.5.
This means that, over the past 80 years and in real terms, the Dow has grown by a tiny shade over 1% per annum, compound.
True, there have also been dividends; but the "get rich quick on the market" idea seems to be a form of riverboat gambling, winners taking from losers.
The biggest winners being the fund managers - so very few of whom even manage to beat the index, long-term, in their own sectors.

Perspective
 (Values at 01 Oct 1928 = 1)
 "There must be some way out of here,"
Said the joker to the thief.
"There's too much confusion here,
I can't get no relief.
Businessmen they drink my wine
Plowmen dig my earth
None of them know along the line
What any of this is worth."
"No reason to get excited,"
The thief he kindly spoke.
"There are many here among us
Who think that life is but a joke...
- Bob Dylan
Thursday, February 26, 2009
Still a bear, for now
A letter to the Spectator (unpublished), posted here on 2nd November 2008. We seem to be edging towards the "unsurprising", though the market may give a leap of denial before then:
Sir:
Your leader (“Riders On The Storm”, 1 November) suggests that current investor sentiment is “excessively negative”. That depends upon one’s historical perspective, in both directions.
A reversion to the mean (over the last generation) for UK house prices would be some 3.5 times household income, which on 2007 figures would imply average valuations around £120,000. Turning to shares, the progress of the Dow over the past 80 years (adjusted for consumer prices) indicates that a return to 6,000 points should be unsurprising, and a low of 4,000 not impossible.
But in addition to the business cycle and recurrent bubbles, there are deep linear changes at work. While maintaining the Western consumer in his fantasy of idle wealth, the East has been building up its human and physical industrial resources. We are focussing on the present recession, but not what the world will look like afterwards. When Asia has sufficiently developed its domestic demand, it will lose its enthusiasm for US Treasury debt, and the credit markets will tear at our economies with higher interest rates. Already, the search is well under way for an alternative to the US dollar as a world trading currency; and foreign investors, sovereign wealth funds and oil-rich governments are building up holdings in our bellwether businesses (e.g. Barclays Bank), thus converting imbalance into equity and exporting our future dividends.
Besides, the Dow and FTSE companies derive an increasing proportion of their income from abroad, so stock indices no longer reflect national prosperity. Real wages have stalled, and seem set to decline against a background of rising inflation and global competition; this, plus an interest rate correction, might strengthen the downward trend for house prices.
In short, successive governments have failed to repair our economic structure, and bear market rallies notwithstanding, I think we must eventually recalibrate our measures of normality.
Wednesday, February 25, 2009
Dow update
Adjusted for CPI inflation, the Dow is now back to where it was in December 1995.
This is still above the peak of the previous long cycle, ending in January 1966 - and still over 4 times higher than the low of July 1982. We only think of it as catastrophic because we got used to more recent, wildly inflated valuations.
I'm still hoping that the end position will be no worse than 4,000 points - a drop of 45% from today's close.
How long will the bear market last?
Jesse quotes this comparison of the current bear market with three previous ones, mixing stats for the Dow and the S&P 500:

 I'd suggest we should look at when the recent bubble really burst - end 1999, then desperately disguised by monetary inflation from 2002/03 onwards; if that's right, we have maybe another 6 years to go through.


But taking similar periods for the Dow only, adjusting for CPI inflation, and adding the long period from 1966 to 1982, we get this:
 I'd suggest we should look at when the recent bubble really burst - end 1999, then desperately disguised by monetary inflation from 2002/03 onwards; if that's right, we have maybe another 6 years to go through.
 The shapes of these two lines do sort of rhyme, don't they? And if so, looking at where the end of the red line is, maybe a bear market rally is now due, like the c. '75 - '76 mini-recovery.
End point in real terms this time, my guess, is the equivalent of 4,000 points today. However, there are features unique to the present situation, especially the size of debts, the loss of much of the West's manufacturing base, and the interconnectedness of modern world markets and economies.
Thursday, February 05, 2009
Stock market could halve again - more evidence
I've been following this alarming idea recently. Now Russell Napier chips in, citing Tobin's Q as a measure to predict a further 55% stockmarket decline within the next five years (htp: Financial Sense).
I had a look at Tobin's Q last April. Are we coming to some gloomy consensus - except for Karl Denninger, who fears it could be worse?
I had a look at Tobin's Q last April. Are we coming to some gloomy consensus - except for Karl Denninger, who fears it could be worse?
Saturday, January 31, 2009

Friday, January 30, 2009
Dow 2,000: confessions of an optimist
 Karl Denninger looks at one of the shapes chartists use to guess market movements, and concludes that a Dow fall to 2,000 points is one possible outcome.
Back in November, I did my own work on the "in-real-terms" Dow (i.e. adjusted for CPI), and if history repeats itself, a fall to below the equivalent of 2,000 points would merely be a repetition of what happened twice in the 20th century. But the second low (1982) was not so deep as in 1932, and in December I re-drew the graph with (sort of) reassuring curvy lines, which suggested that maybe the low point next time might only be c. 4,000 points.
This latter attempt of mine sturdily ignored two facts: debt, and its recent monetization (look at Tim Iacono's second graph here) have gone far past all previous levels; and so did the Dow in its "twin peaks" episode of years 2000 and 2007. Maybe the next low will be as devastatingly deep as the last peaks were dizzyingly high.
I will comfort myself with the illusion that the Dow will merely halve, until reality proves me wrong.
Saturday, January 10, 2009
The next wave of bailouts
It's not just the banks that are short of money. Many US States and local authorities are also suffering financial problems, and this is affecting the trade in their bonds, i.e. their borrowings on the money market. ("What are bonds, exactly?" - see here.)
Michael Panzner reports that municipal bonds ("munis") offer a better yield than US Treasury bonds, but the difference is still not enough to pay for the extra risk. Professional investors are short-selling "munis". i.e. betting that they will fall in price. A steep fall may indicate imminent bankruptcy, and some say this is on the way for many authorities, as Mish reported at the end of December.
So, what will happen when the US Government is seen to be buying everybody's bad debts?
People (even here in the UK, where we tend to wait patiently for our wise rulers to solve all) are beginning to worry about inflation, and are thinking about investing again. An article in Elliott Wave International warns us not to be panicked into parting with our cash, and reminds us:
... there are periods when inflation does erode the value of cash. I mean, look at the seven years leading up to the October 2007 peak in U.S. stocks: big gains in the stock indexes, while inflation was eroding cash. No way did cash do as well as stocks during that time.
Right?
Wrong. Cash outperformed stocks in the seven years leading up to the 2007 stock market high. That outperformance has only increased in the time since.
Since this is the view I took and communicated to clients in the 1990s, you will understand that I didn't make much money as a financial adviser. But it was certainly good advice, even if it was based on strongly-felt intuition rather than macroeconomic analysis.
Not that analysis guarantees results, in a world where the money game's rules are changed at will by politicians with a host of agendas that they don't share with us ordinary types. But my current guess is that the stockmarket will halve again in the next few years, when compared with the cost of living.
Friday, January 09, 2009
Stock market could halve again
As you know, I've been doing my own extrapolations recently, based on the Dow since 1928, and the implication is that the low point could be as deep as c. 4,000 points, i.e. another 50% off where it stands today.
Now, "Mish" looks at revised earnings estimates for companies and relates them to stock prices, applying various price-earnings ratios. His conclusion is broadly the same.
As Michael Panzer predicted* (reviewed here in May 2007) there's been a flight to cash, and now (as he also predicted) it looks as though inflation is set to roar. This will disguise what's happening to stocks, but underneath it I see that decline. As in the '60s-'80s. it may take some years after the apparent turnaround before real values increase again.
Provided you trust the government to pay up when due, and to calculate inflation fairly, National Savings Index-Linked Savings Certificates (or US TIPS) may be a valuable weapon in your anti-inflation armoury.
*"He predicts first a credit squeeze, which makes cash king and ruins our credit-dependent lives and businesses wholesale; then hyperinflation, as the government prints money to keep the system from complete collapse.
In this scenario, at first, stocks, corporate bonds, property, commodities (including gold), even government bonds and savings certificates, all decline in value against hard cash as everybody scrambles to settle their own debt, collect what's owed to them and continue to pay the bills. Then the hyperinflation hits and everybody tries to offload their currency."
Tuesday, December 30, 2008
Fun with extrapolation
Since the 1990s, the stockmarket has been showing such freakish returns that many thought we were in a "new paradigm", whatever that means.
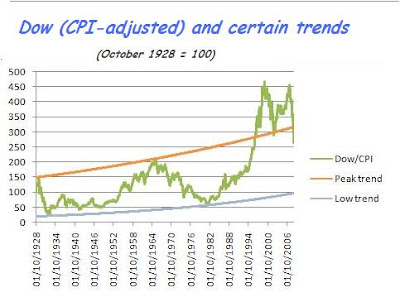
So I've looked at the Dow adjusted for CPI since late 1928, and calculated max/min lines on the basis of the highs in 1929 and 1966, and the lows in 1932 and 1982, to see just how unrepresentative the last decade has been. If we saw a return to these imaginary trends, the next Dow low could be less than half the present value. If, if, if...
Coincidentally, Jim Kunstler is predicting much the same:
By May of 2009, the stock markets will resume crashing with the ultimate destination of a Dow 4000 before the end of the year.
But I think it may take longer than that. The Elliott-wavers are looking for a final upwave first. Having said that, the last 10 years have been out of all comparison with the 70 years before.
Saturday, December 27, 2008
Is gold a hedge against inflation?
There are problems with using gold as an insurance against inflation.


(N.B. gold prices to the end of 1967 are annual averages, then monthly averages to the end of 1974, then the price is as on the first trading day of the month; all gold price figures from Kitco).
1. Governments interfere with it - from making it the legal base of their currency, as in the US Constitution, to making it illegal to have any, as in the US in 1933; from guaranteeing the exchange rate of gold against the dollar (post WWII) to the Nixon Shock of 1971, when the gold window was closed.
2. Central banks claim to hold it, then (it is widely suspected) lend or sell it surreptitiously.
3. There is so little of it, that speculators can have a significant effect on the price, especially if (as appears to have happened in recent years), the speculation has been powered by vast amounts of borrowed money.
Below, I give three graphs, all comparing the price of gold per ounce in US dollars with inflation as measured by the Consumer Price Index (and that's another can of worms). It's clear that gold has a very volatile relationship with inflation and can spend a very long time above or below trend.
In the fourth graph I divide the Dow by the price of gold. It seems obvious that gold is a contrarian position for equity investors, rather than a simple hedge against inflation.
Currently, the Dow has come back to something like a normal ratio to gold, but past history suggests there will be an overshoot. And gold itself seems above trend over all three periods chosen; which suggests that both still have a way to fall in nominal terms, but the Dow more so.


(N.B. gold prices to the end of 1967 are annual averages, then monthly averages to the end of 1974, then the price is as on the first trading day of the month; all gold price figures from Kitco).
Friday, December 26, 2008
Nominal and real
Marc Faber's latest interviews on Bloomberg and CNBC show him estimating the recession to last "2, 5, 10 years". He also says that Asia is better placed to recover, because after the panic of 1998 they deleveraged, i.e. reduced borrowings.
So it's time for me to review my guesses about when the recovery will come for us. A key consideration is inflation, which Faber says is being stoked up for the long term by all the "stimulus" currently put in by panicky Western governments.
I've suggested that we might compare the present, not to the 1929-32 collapse, but the period 1966-1982, when inflation sometimes growled and sometimes roared. The result was that the nominal and inflation-adjusted low points are very far apart: the start-of-month level for the Dow hit bottom in September 1974, but adjusted for CPI, the real bottom was in July 1982.
So when the upturn comes, depends on your definition. I am still guessing that there will be a nominal recovery in 2010, but inflation will erode gains over time and the real turning point may not come until, say, 2016.


Wednesday, December 24, 2008
Relativism
It's hard to measure what's going on, because currencies have turned out to be rulers made out of very stretchy elastic - especially for us Brits, recently.
In this article, Kurt Kasun reproduces a chart from Marc Faber's latest newsletter, showing an estimated drop of c. 50% on the world's stockmarkets - a loss of some $30 trillion.
So I've looked at the Dow and the FTSE, as priced in Euros, since the Euro appears to be more stable than either the dollar or the pound sterling (until we discover the supermassive black hole at the centre of the European financial galaxy, no doubt).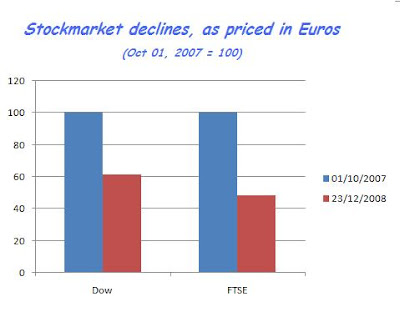
Friday, December 12, 2008
History repeats itself - because it's getting old
Jesse extrapolates the Dow and sees it heading for 2,000 points:
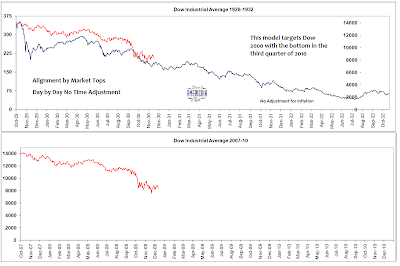
As my select and distinguished readers now know, I'm an optimist (by the standards of unfolding reality), and I say, not so. I say, maybe 4,000 - 5,000, adjusted for CPI.
The comparison I'd urge is not with 1929-32 (stockmarket deflation exacerbated by monetary strictness), but (in inflation-adjusted terms) from January 1966 to July 1982: stockmarket deflation prolonged and partially disguised by monetary inflation; I said so here and here, last month. I maintain that the bear market began in 2000 and the symptoms were masked by the terrible extra debts taken on over the last 8 years. Karl Denninger showed us yesterday that these debts account for all the US GDP growth since the New Millennium, plus $9 trillion.
The debate about inflation and deflation continues, though from a British perspective we've seen practically the whole of the rest of the world become one-third more expensive in sterling terms, in only five months. However, Einstein's theory of relativity rejects the notion of any absolute standpoint, and we shall see next year which other currencies mimic sterling's vertiginous fall.
In these shifting times, it becomes very hard to discern real value; but however hard to measure, it exists nevertheless. There is a real bill to pay for our excesses, and I think 2008 will be seen in retrospect as the year that the global balance of power underwent a sudden tectonic shift, from West to East. Yes, the East will suffer for a while, too, but it has long been acquiring the means of production and developing its local markets, and will emerge from the crisis ahead of us.
And there will also - must also - be an intergenerational shift of power, within our Western societies. As globalization continues and real income and real house prices decline, existing debt (set in fixed terms) will become proportionately greater, until the weight is too great to bear; and the worst of it falls on the people who are also struggling to raise families and save something, however inadequate, for their old age. They cannot be crucified in this way. How can savers be taxed at 20% and workers at (effectively, on margin, including National Insurance) 40%? Real wealth must flow from one to the other, just to maintain civilization. I think either savings must be taxed more (perhaps the removal of tax exemption for some savings products will be the start), or inflation must come, though I don't know how long the play will go on before the denouement.
We did have another option, and I was only half-joking: cancel mortgage debts on a massive scale (bankrupting the banks and the bankers, and serve them right). Then, with our productive populace relatively unencumbered, it would be possible to let Western wages and prices fall to much nearer Eastern levels, and we could begin to compete.
I prefer Alexander's handling of the Gordian knot, to Gordon Brown's. For me, debt forgiveness is the way; but that's too radical, it seems. Instead, inflation will have to diminish the real value of debt, but jerkily, as the debt-holders periodically jack up interest rates in a fighting retreat. All to hide from reality. "Oh, what a tangled web we weave..."
Monday, November 24, 2008
If the 2003 reflation hadn't happened?
 What if the banks hadn't gone for broke from 2002/2003 onward?
In the above graph, I show the Dow, adjusted for CPI, up to 19 November 2008, with an extra: the gold line is the same as what actually happened from the beginning of 1966 to November 1974, adjusted proportionately to the height of the boom at the end of 1999.
Interpreted and represented in this way, even the worst of the crash so far has not caught up with the mid-70s: the Dow closed last Wednesday at 7,997 where 32 years before it would have been the equivalent of 4,911. If that period of history were to repeat itself, the Dow would take another 7 years of whipsawing towards its low of 3,988 in today's terms.
So in my view, the monetary expansion of the last 6 years or so, has merely delayed progress a little. The drunkard has had a few more to put off the hangover.
Sunday, November 23, 2008
River deep, mountain high
 How long do bear markets last?
There's how long the market takes to bottom-out, and then also how long it takes to match its previous peak. In real terms (adjusted for CPI), here's the last two Dow bears:
1929: 3 years to hit bottom, lost 86% of its peak value, in all took over 29 years (i.e. in 1958) to match its 1929 high; then a further 8 years to reach a new record top
1966: 16 years to hit bottom, lost 73% of its peak value, in all took over 29 years (i.e. in 1995) to match its 1966 high; then a further 4 years to reach a new record top
1999: ...
See you back on the high slopes in 2029?
Subscribe to:
Posts (Atom)