I’d long been interested in Tibet and had a romantic vision of the Land of Snows, but I’d never been there. Now I learned that the Tibetans have a different way of seeing the world. My classmates were Buddhist and had a strong faith, which inspired me to reflect on my own views about the meaning of life. I had been a materialist, as all Chinese are taught to be, but now I could see that there’s something more, that there’s a spiritual side to life.
[...]
The Chinese protesters thought that, being Chinese, I should be on their side. The participants on the Tibet side were mostly Americans, who really don’t have a good understanding of how complex the situation is. Truthfully, both sides were being quite closed-minded and refusing to consider the other’s perspective. I thought I could help try to turn a shouting match into an exchange of ideas. So I stood in the middle and urged both sides to come together in peace and mutual respect. I believe that they have a lot in common and many more similarities than differences.
But the Chinese protesters — who were much more numerous, maybe 100 or more — got increasingly emotional and vocal and wouldn’t let the other side speak. They pushed the small Tibetan group of just a dozen or so up against the Duke Chapel doors, yelling “Liars, liars, liars!” This upset me. It was so aggressive, and all Chinese know the moral injunction: Junzi dongkou, bu dongshou (The wise person uses his tongue, not his fists).
Read the rest of Grace Wang's Washington Post article here.
Wednesday, April 30, 2008
Tuesday, April 29, 2008
GloomBoomZoom vs. GloomBoomDoom
Not only do we have the Great Debate about 'flation (In- vs. De-), but selective quotation can make the same expert give evidence for both sides.
Here it looks as though Dr Marc Faber is expecting inflation:
Dr Marc Faber has argued that even in the United States, where property prices are in decline, in an environment of high inflation he would rather own a US$1 million home than hold the same amount of cash or bonds, because the house would better preserve value.
... but here, its extreme opposite:
The view Marc is putting forward is the opposite one - that deflation will be the clear winner, dragging the whole world economy into a slump, with lower prices for commodities as well as stocks and property...
...In a real downturn, the United States (and other developed nations) would stop importing so much oil...and so much merchandise from China, which would have the consequence of reducing energy consumption by China too. Result: lower energy prices and a worldwide recession...maybe even the worst worldwide depression in history.
I think the giveaway in the first, is in the qualifying phrase "in an environment of high inflation". All I've read so far about Marc Faber indicates that his real position is represented by the second.
In my (amateur?) view, we're heading for a bust, and unless it can be avoided (which would be wonderful news), then the sooner, the better. Ideally, it would have happened in 2000 - in fact, it did, but we then got the reckless monetary reflation of 2003-2007.
Why soon? Because the longer it goes on, the more the transfer of productive capacity to the Far East, so that when recovery comes, we in the West won't be equipped to restart.
Sunday, April 27, 2008

Saturday, April 26, 2008
Cure, effect, cause
A paper from the Levy Economics Institute is arguing (at least theoretically) for an extra US fiscal stimulus of 4% of GDP. That's $600 billion.
The authors say that the effect would be better if this reflation came in the form of additional direct government spending, though they acknowledge that it still wouldn't immediately halt the economic decline:
It is somewhat discouraging to see that even a relatively large stimulus plan will fail to prevent a substantial loss of output. But over the medium term, as the devaluation of the dollar and reduced spending begin to exert a moderating effect on the current account deficit, foreign trade will boost output and employment, providing the impetus for renewed growth.
Karl Denninger begs to differ (though in his case, he's still talking about transfers of money, rather than direct government expenditure):
But now we have reached the point where we need $5 in debt to create $1 worth of GDP. As debt levels rise this ratio goes parabolic and ultimately becomes impossible to sustain. That we have reached a 5:1 ratio means that the game is basically up, and the rapidly rising rate of defaults across all areas of consumer debt mean that this "engine" to fuel "growth" simply can't find any more fuel, despite the desires of the bankers and merchants to "make it so."
The Levy paper has echoes of FDR's 30s rescue, but Denninger is more concerned to compare the present mortgage bubble with the one that led to the Crash of '29:
...we've done this before... We saw, in fact, nearly the exact same pattern of practice, fraud and theft that were featured in the housing bubble during the years just before The Depression, and those "standards" in fact were a primary causative factor OF The Depression!
So maybe both parties are correct.
It's also possible that the Uk has got it wrong even worse than Uncle Sam. $600 bn is about £300 bn sterling, but adjusted for relative population size that's only equivalent to £60 bn pumped into the UK economy. We're already talking about a possible £100 bn-worth of mortgage garbage being swapped by HMG for government bonds - and our current fussing over Gordon Brown's crumbling reputation suggests that Prudence wouldn't dare try to reflate with even more direct government spending.
Besides, we are starting with a higher debt-to-GDP ratio than the USA, a State that consumes a bigger proportion of the economy, and a populace that suffers a significantly lower level of personal income on a Purchasing Power Parity basis.
Maybe that's why the pound is matching the dollar in its downward trajectory, and may even overtake it.
I've been wondering recently whether the ordinary investor of the future will be more interested to play in the foreign exchange markets, rather than stocks whose value is lied about, manipulated by rumour and sovereign wealth funds, and nibbled half to death by fees, commissions, taxes and inflation.
UPDATE - Karl Denninger is emphatic that it can't work:
Sack, no.
You can't spend $600 billion in deficits without it coming back SOMEWHERE.
Government spending is not a net positive. You can't only get to a net positive via growth in GDP.
Debt-initiated spending only returns $1 for every $5 taken on in debt.
Wednesday, April 23, 2008
Mortgage bond re-rating: reversing the rescue?
Karl Denninger notes that Moody's have re-rated previously "AAA" packaged mortgage products, and points out that since the Federal Reserve only accepts AAA, it may be forced to send much of this stuff back and demand better collateral. The banks' headache returns.
Tuesday, April 22, 2008
Second blow
TV ad tonight: Woolworths children's jeans £2. I said, you wouldn't have got a zip for £2 a few years ago. (So many Birmingham kids I used to teach years ago thought school didn't matter, they'd be getting a job at Tucker Fasteners anyway. That or Lucas' - now joining the list of nostalgia subjects.)
Then a thought: when the recession really bites, the price war will be unrestrained. I don't know what is still manufactured in Britain, but in the second phase, when the poor become acutely cost-conscious, I can't see domestic manufacturers staying in business.
Of course, with social benefits still generous, we're not there yet (they're still buying their kids Xboxes and Lacoste trainers, while SoSecurity lay on taxis to take the tearaways to school-for-the-expelled); but wait for the tax and benefit reviews when public finances finally unravel.
And if I ever do get another new car (the Fiat Brava is kept going on a radiator refill every Saturday), maybe it's the Tata Nano for me.
I'm looking at checkmate and trying not to believe it. But that's my problem; the difference between Western waster education and Chinese school is too clear. And we'll be a sort of nationwide museum of once-were-workers. But I don't want to live in the past.
Quality down, as well as prices up
Good article in iTulip about the symptoms of inflation to watch out for.
Monday, April 21, 2008
£50 billion liquidity injection - what does it mean?
£50 000 in £50 notes weighs about 1.3kg. So £50 bn = 1,300 tonnes, or 1,279.46 British long tons, of paper.
In 1936, the Aga Khan was presented with his weight in gold, then 220 lb, or c. 100 kg. Gold currently sells for £14,891.58 per kilo, making the Aga Khan's weight in gold worth £1.49 million in today's prices. However, 100 kg of £50 notes is worth £3.85 million. The £50 notes would weigh as much as 13,027 Aga Khans, but would be worth 33,576"gold-priced Aga Khans".
Or, in pre-crash property terms: it is reported that Sheikh Hamad paid £100 million last year for a penthouse overlooking Hyde Park. Mervyn King has just pledged 500 "Hamads" (or over 700 "Updown Courts", if you prefer).
Or, in height terms:
1 ream of paper (500 sheets) is 5.4 cm thick. So 1 billion £50 notes would make a pile 108 kilometres, or 67.1 miles, high.
Were the Aga Khan of that time to have been the height of the average British man of today (5 ft 9 in, or 1.753 metres), £50 billion would equate to a stack of "gold-priced Aga Khans" (without shoes) almost 59 kilometres high. *
The lowest layer of the Earth's atmosphere, the troposphere, varies from 8km at the poles to 16km over the equator; the ionosphere starts at an altitude of about 80 km, and the US Air Force considers "space" to begin at 81 km.
Perhaps it would be simpler to use a new unit: the "government fudge", one box of which costs £50 billion.
By the way: hands up all those who believe the Prescott bulimia story, of which up to now there was not one breath? Now, hands up all those who have an explanation as to why this story should appear this weekend?
* I think this shows that the Aga Khan was worth twice his height in £50 notes.
Sunday, April 20, 2008

Saturday, April 19, 2008
On freedom
Freedom is not a solitary journey through a desert, where every error and deviation may be fatal; it is found between the hedges and walls of a populous land, defining sovereign islets that combine in mutual defence and succour.
Like a musical string, its harmony relies on bounds. It is the tension between tyranny and anarchy, a common land affording refuge from public and private oppression. It is not lawless. Liberty is to defy another's rule; freedom, to obey one's own; free doom, the "freo la3e" of La3amon's Brut. No law, no freedom.
And now, confusedly and perhaps too late, we must begin to defend our freedom. Here in the once United Kingdom, our self-rule is fragmenting and being sold piecemeal to an unlicked bear-whelp of an aggregated foreign power; in the United States, many of the people and a handful of their representatives are calling for a rally around the principles of the Constitution, while the government becomes forgetful of its foundation. In both, there is economic mismanagement and perilous concentration of wealth. The Big Brother of a political power cutting itself free from popular franchise has his arm round the shoulder of Big CEO, whose business no longer depends on the community from which it sprang. The land will be cleared or peopled at its masters' pleasure; they will move us between their pastures for their profit. The movement will show us that the earth is not ours. We shall be rootless. We shall be dispossessed, wanderers, desperate hired men, like the landless Gregora of Scotland.
This is where we were some two centuries ago. It must all be fought for again, but perhaps, like the valiant tailor, we shall again find a way to overcome the rich and powerful who ravage our lands. Long before the battle, the American Revolution began to assemble its forces among a rabble of pamphleteers, philosophers, dissident clergy, smallholders, inventors, dreamers and adventurers. Every voice, however small, adds to the chorus.
My brother became an American citizen yesterday. Part of the ceremony was a homily, in which the presiding official said (was it a quotation from Jefferson?) that liberty was not passed down to one's children by nature, but by one's actions.
Although my brother has his own views on religion, and although I feel that America has, and has always had, much to learn in its foreign relations, it is without irony that I wish a blessing on America and the American people, and my newly American family.
UPDATE
Not Jefferson:
"Freedom is never more than one generation away from extinction. We didn't pass it to our children in the bloodstream. It must be fought for, protected, and handed on for them to do the same, or one day we will spend our sunset years telling our children and our children's children what it was once like in the United States where men were free."
Ronald Reagan 40th president of US (1911 - 2004)
Friday, April 18, 2008
Denninger calls for a borrower's strike
It lifts your heart a little to read someone who still believes in his country and is unafraid to express moral indignation. Here Karl Denninger advocates getting a home safe for your hard-earned - something the Japanese went into in a big way when their deflation hit.

Speaking of Japan, the Nikkei shows that the stockmarket can disappoint for long periods:
Hi ho-ho, hi ho-ho
It's stagflation, obviously, says Lance Lewis. And he expects gold to resume its climb. Good news for China: "The world’s largest producing nation with 276 t was [in 2007], for the first time, China", says 1read's Weblog.
For the playful, you can join the game here.
For the playful, you can join the game here.
Thursday, April 17, 2008
China sponsors African dams, for minerals
See this blog on Chinese support for foreign hydropower projects - and their growing responsiveness to ecological issues nearer home.
Tibetology
The New York Times on China, museums and winner's history.
But is it possible that some of our own museums have an agenda or two?
But is it possible that some of our own museums have an agenda or two?
Big Brother has a thin skin
A nightmarish account by a Swedish lawyer, of how the State in her country snatches children from perfectly OK parents, partly because there's a good living to be made from it, and sometimes for squalid emotional revenge. Nurse Ratched unleashed on the family, a much wider target than the mentally ill. But I suppose this is what we get as the State expands.
htp: Schadenfreude
htp: Schadenfreude
Wednesday, April 16, 2008
Weaknesses in US depositor protection
A very timely article from Financial Sense on the FDIC and its limitations. After reading this, UK depositors may not be so keen to replicate the system.
htp: Michael Panzner's "Financial Armageddon" blog.
htp: Michael Panzner's "Financial Armageddon" blog.
Saturday, April 12, 2008
And after Tibet?

This is the disputed territory of Arunachal Pradesh (red) - currently Indian, formerly part of Tibet, and included in Tibet on modern Chinese maps. See "Better Days" blog post (Nov 2004) here; a current Indian political comment here; Wikipedia entry on the region here. >>>>>>>>>>>>>>>>>>>>>>>>>>>>>>>>>>>>>>>>>>>>>>>>>
Tibetans number an estimated 5 - 7 millions. The official Chinese 2000 Census has the Chinese Han population in the "Tibetan Autonomous Region" (TAR) as merely 6% of the total. However, as this illuminating BBC guide explains, the TAR is not Tibet as its government in exile defines it. The larger Tibetan area including Amdo and Kham contains 6.5 million Tibetans and 8.5 million Chinese immigrants. And there may be bigger plans: "Chinese demographers back in the 1980s estimated that Tibet could provide living space for 100 million Chinese."
Tibet is important because of timber, minerals, extra living space for Chinese - and it houses up to a third of China's nuclear arsenal. A major interest is water, because Western China is very dry; among other plans, one is a hydroelectric plant exploiting the Brahmaputra River, which further down flows through Bangladesh and ultimately joins the Ganges. The Chinese claim it will have twice the output of the Three Gorges Dam. "Work is tentatively scheduled to begin in 2009 but has been described as a 'declaration of war' against India and Bangladesh. One of Tibet's most sacred lakes, Yamdrok Tso, has already been mined, tunnelled and used for hydroelectric development."
The population of Arunachal Pradesh (formerly a part of the Indian state of Assam) is slightly over 1 million. The area was a lifeline to China in WW2 after the Burma Road was cut off by the Japanese in 1942. It is well watered and forested.
UPDATE
Climate change already threatens to reduce the great northern Indian rivers to "seasonal water flows", without further constriction by Chinese projects. The potential extra disruption is discussed in this Guardian article from a year ago.

Friday, April 11, 2008
Defying gravity
"...the equity markets are simply not acting in a rational manner given the underlying issues in the economy and credit markets"
So it's not just my perception. Read Karl "hold cash" Denninger's latest.
So it's not just my perception. Read Karl "hold cash" Denninger's latest.
Thursday, April 10, 2008
The boom that wasn't
Karl Denninger just gets better - it's one of the advantages of sticking to your theme and endlessly rehearsing your arguments, as politicians know.
There is only one way that home prices where they are, even today, are sustainable - that would be for wages to rise by 30% across the board. That, of course, isn't going to happen, and if it did it wouldn't do you a bit of good because prices would simply rise to the same degree, leaving us exactly where we are now!..
There never was a "boom" in earnings power for middle America. The median family income - including all quintiles - was actually down $500 or so over the last eight years. If you exclude the top quintile it was down materially - 5% or so. And that's in nominal, not constant, dollars...
We're now going to adjust spending and investment levels to incomes because there is no way for us to adjust incomes to spending levels! The big productivity gains that came from computerization are finished, and we've already offshored nearly all of our manufacturing, so there's no more "cheap labor improvement" available either...
If we can keep the government from screwing things up with more vote-buying attempts we'll get through the other end of this, although people's standards of living will change. You won't be able to afford to milk your house for the second Lexus and six plasma TVs, but is this really such a disaster? I think not.
Read the whole thing in all its beauty here.
Next task, when I have the time, is to see what happened to the middle quintiles in the UK.
Monday, April 07, 2008
It really, really is a swindle
I am grateful to James Higham for directing me to this article by a very distinguished economist, explaining the scam of fractional reserve banking. Even when you understand how it works, you find it difficult to believe; it's a bit like finding out how babies are made, looking at your parents, and... naaaaah!
Where are the police?
UPDATE
I've been directed (see comments) to this video, "Money as debt", by Canadian Paul Grignon:
Here are the artist's own comments; here's the dedicated website; here's his professional artist's website; and here's a link to the Idaho Observer, with a little extra detail on the making of the film - cut off the last part of the address to see more of the Observer's output.
Whether it's right or wrong, simplistic or not, I'm heartened to see practical idealism like this.
FURTHER UPDATE
Karl Denninger explains why the money-lenders won't permit inflation to run away and destroy the basis of their wealth. And why this means the economy will hit the buffers.
If history repeats itself
A few days ago, I looked at the Dow over the past 40 years and concluded that, on average, the real growth rate was very close to the very long-term historical norm.
What I didn't think to do then, is to illustrate the shape of the Dow if it continues to be as volatile as in the last 40 years. So here goes - same average growth, same inflation rate etc:
What I didn't think to do then, is to illustrate the shape of the Dow if it continues to be as volatile as in the last 40 years. So here goes - same average growth, same inflation rate etc:
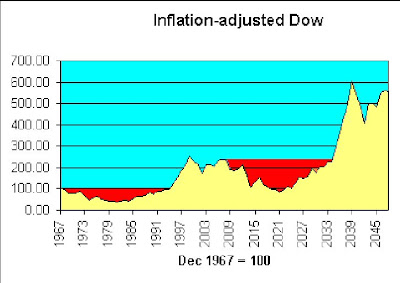 It's the volatility that does you in. As Keynes said, "In the long run..."
Matter of fact, if history repeats itself, there's a point around 2021 where in real terms, we're behind where we were in 1967. This time, I will buy beads and wear flares. I'd still be younger than Robert Graves was last time round.
Chirpy
Don Boudreaux is an economist, yet although an expert in the "dismal science", he is an optimist, which makes a very nice change. He claims it's because he's a professional in the field.
Here he says that America's freedom and creativity will overcome present problems, as they have in the past; here he says the housing market can't be too bad if workers are unwilling to sell their houses in a falling market; and here he claims to love America's trade deficit.
Is he right? Or just seeing affairs from the point of view of a man who's had a good dinner and is assured that, in his case, good dinners will never stop coming? I've often thought that war movies should end prematurely and at different points for a random selection among, say, 20% of the audience, to remove the Olympian perspective.
But it is nice to read someone who thinks it's not all gloom and doom.
Sunday, April 06, 2008
Banks, usury and slavery
In the UK, GDP is said to trend long-term to an increase of around 2.5% per year, hence also the Monetary Policy Committee's figure for inflation target-setting.
Since 1963, the M4 money supply has grown by an average of slightly under 13.5% per year. So that would be about 11% p.a. relative to GDP.
This means that bank lending, as a proportion of GDP, doubles every 7 years.
How long can this continue? How long before we are completely robbed and enslaved? Or am I asking a fool's question?
Saturday, April 05, 2008
Awaiting the caning
 Karl Denninger reports here that the Dow's price-earnings ratio may be overestimated by a factor of 4. And here, that financial institutions will have to bring Structured Investment Vehicles back onto their books within 12 months.
The reckoning - the painful correction - approaches.
Doug Noland (April 4) agrees:
It is my view that our economy will require a massive reallocation of resources. We will have to create much less non-productive (especially mortgage and asset-based) Credit and huge additional quantities of tradable goods. In the “services” sector, there will no choice but to “liquidate” labor and redirect its efforts. Throughout finance, there will be no alternative than to “liquidate” bad debt, labor and insolvent institutions – again in the name of a necessary redirecting of resources. After an unnecessarily protracted boom, there will be scores of enterprises that will prove uneconomic in the new financial and economic backdrop. “Liquidation” will be unavoidable.
Will our wise leaders in the UK learn from this?
P.S. How come (Denninger, here) the Dow p/e appears out of whack by 53:13, but the S&P 500 only 20:14? The latter implies only a possible 30% drop, which is a bit less apocalyptic than the 75+% of the Dow!
Generally the Dow and the S&P have followed similar trajectories over various periods, with a little widening in the last 12 months:

Friday, April 04, 2008

Thursday, April 03, 2008
Fishy business in the gold market
Contrarian Investor reports that gold is being loaned out at negative rates of interest, which he thinks is in order to help short the gold market. There's a manicured thumb on the scales, it seems.
Does asset inflation help support stock prices?
An anonymous comment on the preceding post has set me speculating further. The commentator says:
You are right, but I believe that this time around it will be equities, rather than commodities or real estate that will provide the hedge against coming inflation. Tobin's Q will prevail due to the juxtaposition of equity prices vs. the other two asset classes (which already had their surges) and the market's increasing valuation sophistication compared to the last time we saw hyperinflation in developed economies (i.e. the 1970s). So I've been buying stocks as an inflation hedge, despite the statistical evidence that this is foolish...
Wikipedia offers an explanation of Tobin's Q here. Essentially, Q is a measure of the relationship between the value of all a company's shares, and the value of the company's assets. If Q is greater than 1, there is some reason (real or imaginary) why the company has extra value to offer; if less than 1, a share investor could buy a company's underlying assets at a discount.
In 2006, Michael Alexander wrote a series of articles for Safe Haven, about stock cycles. Below, from the second in the series, is his graph for Q in several bear markets, including the one which he suggests began in 2000:

According to this, Q was already below 1 in 2006, and since the market is now back to about where it was a couple of years ago, that would suggest that shares are now fairly valued in relation to company assets.
But if history repeats itself, the current bear market has a long way to go, since the other three lasted 15 - 20 years. And in each of the previous cycles, Q slumped below 0.4.
Another complicating factor, thanks to the lending boom, is the real estate bubble. Steve Moyer is firmly of the opinion that real estate is very heavily overvalued, even now. So a collapse in that market would push Tobin's Q back up for many companies, a technical indication that share prices would have to drop steeply to get back to fair value (let alone overshoot to below Q=0.5).
In this context, it's worth noting that one of Mike Alexander's books, published in 2000, is titled "Stock Cycles: Why stocks won't beat money markets over the next twenty years".
Wednesday, April 02, 2008
Is inflation negatively correlated with real stock values?
I'm aware that I'm setting myself up to be laughed at by the quants, but I'm playing a hunch. The FTSE graphs I've done over the last couple of days suggested to me that periods of high inflation are bad news for stock prices, as well as for cash.
Obviously, this isn't exactly news - a quick Google leads me to this book by Alicia Haydock Munnell, where she says "The long-run negative correlation between stock prices and the rate of inflation has been confirmed in several statistical studies." Yet another academic study says "The bivariate results for the real stock returns-inflation pair weakly support a negative correlation in the 1970s and 1980s."
But what if we compare real stock prices with changes in the inflation rate? So I've done something childishly simple - perhaps childishly wrong, I await your correction:
First ("L2/J2"), I divided the FTSE index by the RPI index (end December figures in both cases); since the FTSE has grown in real terms by only about 1.6% p.a. since 1970, I think this should reduce some of the statistical noise - in effect, we have the inflation-adjusted value of the FTSE for each year end.
Then I looked at how much the RPI index had changed, year on year, expressed as a percentage.
Then I used Excel to calculate the correlation between the two sets of data. The figure (as you see at the bottom of the sheet) is (0.711). I may be mistaken but I think this shows that there is a strong negative correlation between changes in the inflation rate, and changes in the inflation-adjusted capital value of the FTSE.
(By contrast, the correlation between the annual percentage increase in RPI, and the annual percentage increase/decrease in the FTSE, is only 0.275576.)

Thinking about this, it would make sense: when inflation starts roaring away, investors will want better yields on stocks, so (as with bonds) the value of stocks needs to fall. The question is, how long does it take for the dividends to compensate for the capital loss, to someone who held the shares before the major inflationary period began?
Maybe the sales line that stocks are a long-term hedge against inflation, is only half-right: it'd pay even better (when inflation begins smouldering) to switch out of cash, bonds and stocks and into other stores of value (such as commodities and houses), and come back again when the inflationary fire looks as though it's been brought under control. Look at the real capital values of the Dow and FTSE in these graphs, and imagine you had stayed out for a decade or more, then jumped in with your portfolio in the early 80s, or mid 90s.
But speculators have already gotten into commodities, and (thanks to greedy banks and lax governments) houses are massively oversubscribed. Nevertheless, commodities may yet be a better long-term punt than the average investment at this stage, and there are those who will argue the case for good agricultural land. So maybe there's still an opportunity to get on the cruise ship, even if we've missed the speedboat?
It's so difficult when, as Marc Faber says, for the first time we're in a world-wide bubble. This nasty combination of monetary and fiscal crises has us running in all directions.
UPDATE
Yes, I've got my methodology wrong, as my brother has pointed out. So I'm back to the simpler, positive (real, but not so strong) correlation between percentage changes in the FTSE and the RPI: 0.275576. Interestingly, the correlation is very slightly better (about 0.285), if you look at the FTSE 12 months ahead of the RPI.
It's just that, visually, the inflation "mountain" of the 70s and early 80s seems to want to turn upside down and fill the inflation-adjusted "crater" of the FTSE in the same period. But at least there is a definite correlation, over the series as a whole from 1971-2007.


Tuesday, April 01, 2008
Panic overstated?

40 years on from the Summer of Love. Here's a chart I made to show the capital value of the Dow at the end of each calendar year.
I used Yahoo! for Dow valuations (ex dividends); rebased them so that Dec 1967 = 100; and adjusted for cumulative inflation as per Inflation Data's calculator.
Theoretically, someone investing a sum in the Dow at the end of 1967 would have had to wait 28 years to see it return to its original (inflation-adjusted) value.
But over the whole 40 years, the averaged return is 2.175% per annum compounded, which is very close to the 2.2% p.a. real capital growth on the S&P 500 (1871-2006) illustrated in the previous post.
These long views suggest that the Dow's recent 12-year zoom is merely a kind of rebalancing. In this context, it's interesting to see that as of September 2007, the price-earnings ratio of the S&P 500 is not far off its average over the period since 1871. The fall in stock valuations since then should have brought the p/e ratio even closer to the norm.
By way of comparison, here below is the result of a similar exercise for the FTSE, though I have been unable to go back further than 1970. Again, it's the close at end December each year up to 2007, adjusted in this case for RPI. FTSE stats from Wren Research, RPI from here and (for the latest 2 years) here.
The overall shape looks fairly similar to that of the Dow over the same period. Average capital gain over 37 years is c. 1.6% p.a. compounded.

Dow & S&P500 adjusted for inflation - importance of dividends

 Source: The Big Picture


Source: Inflation Data
Subscribe to:
Posts (Atom)