Showing posts with label Dow. Show all posts

Thursday, November 20, 2008

The reality goggles are smeared

This project of mine is echoed by Eric Janszen of iTulip. His graph and red line suggests what I've been saying recently, that the Dow's trend (if it has one) could be to 6,000 points, with an overshoot to 4,000.

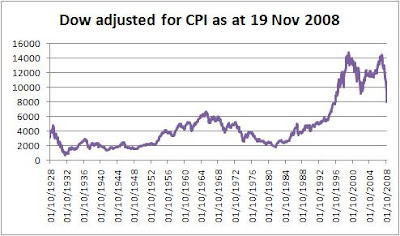
My independently-researched version:

iTulip's:


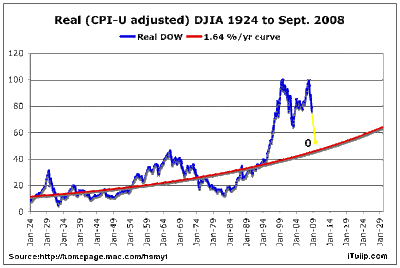
It's really hard to see the past in our own terms. I'm trying to do it using the Consumer Price Index, which opens another can of worms about the composition and weighting of that index, especially since (I understand) it affects government statistics and benefits. However, you have to start somewhere.

The first thing to note is how freakish recent years have been. If you connect previous start-of-month highs (August 1929, January 1966) and extended the line, you'd expect the recent Dow highs of 1999 and 2007 to be no more than 10,000 points.

And as for the lows: the drop from 1929 to 1932 was 86% "in real terms"; from 1966 to 1982, 73%; and so far since 1999, 46% - but this last from an amazing historical high. And the 350%-plus American debt-to-GDP ratio is quite unprecedented.

So the history of the last 80 years offers no clear guide as to what could happen next. If proportionately as severe as 1932, the Dow could dive to about 2,100 points; if like 1982, just below 4,000. BUT the second of these great waves crashed rather less than the first, so maybe the third will be even more merciful, perhaps a top-to-bottom fall of only 60%, i.e. end up at c. 5,900.

I note that the Dow has closed tonight at 7,552.29. What a fast fall we've seen - will it spring back sharply and then recommence its decline, as in previous cycles, or is it popping like a balloon?

Methodology

I've noted the Dow as it stood on the first trading day each month, starting October 1928 and ending November 2008 (plus where it stood yesterday - 7.997.28 - since we've seen a further steep fall). Then I've noted the historical CPI as at the end of the previous month in each case. Then, looking at the latest Dow figure, I've adjusted historical Dow figures accordingly (i.e. Dow then/CPI then, times CPI now).

Sources: Dow: Yahoo! Finance; CPI: InflationData.com
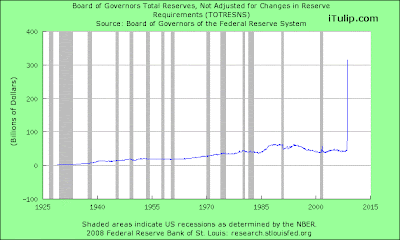
UPDATE

iTulip today also reproduces its graph on holdings at the Federal Reserve bank, underscoring the point that the current crisis has features that we can scarcely compare to anything in the last 80 years. Except that it's unlikely to be good news.

Saturday, November 15, 2008

Looking back, looking forward

UPDATE: "This secular bear market will last a lot longer and be much deeper than anyone thinks. Sadly, very few are prepared for it." - Mish.

This gels with what Marc Faber was saying quite some times back, that the market had further to drop than many people thought. Equities may seem to be fair value in terms of multiples of their earnings, but when the earnings fall, valuations have to be reassessed.


Thursday, November 06, 2008

Sunday, November 02, 2008

Dow 4,900 - sometime?

I'm still working on looking at the Dow in real (CPI-adjusted) terms. Meanwhile, note that in two previous cycles, the Dow dropped to a third of its former peak: from 15 to 5, from 30 to 10 (see red dots).

If history repeats itself, then in real terms the Dow would again lose two-thirds of its value, from 66 to 22, which considering last autumn's peak would imply an ultimate low (if it happened all at once, tomorrow) of about 4,900 points.

But in the previous cases, the process took years to complete, and I would expect it to be a long affair this time, too. The Dow may not hit this 4,900 low in nominal terms.

Continuing this theme, may I draw your attention to the letter I emailed to The Spectator today?

Yet another letter to the Spectator

Sir:

Your leader (“Riders On The Storm”, 1 November) suggests that current investor sentiment is “excessively negative”. That depends upon one’s historical perspective, in both directions.

A reversion to the mean (over the last generation) for UK house prices would be some 3.5 times household income, which on 2007 figures would imply average valuations around £120,000. Turning to shares, the progress of the Dow over the past 80 years (adjusted for consumer prices) indicates that a return to 6,000 points should be unsurprising, and a low of 4,000 not impossible.


But in addition to the business cycle and recurrent bubbles, there are deep linear changes at work. While maintaining the Western consumer in his fantasy of idle wealth, the East has been building up its human and physical industrial resources. We are focussing on the present recession, but not what the world will look like afterwards. When Asia has sufficiently developed its domestic demand, it will lose its enthusiasm for US Treasury debt, and the credit markets will tear at our economies with higher interest rates. Already, the search is well under way for an alternative to the US dollar as a world trading currency; and foreign investors, sovereign wealth funds and oil-rich governments are building up holdings in our bellwether businesses (e.g. Barclays Bank), thus converting imbalance into equity and exporting our future dividends.

Besides, the Dow and FTSE companies derive an increasing proportion of their income from abroad, so stock indices no longer reflect national prosperity. Real wages have stalled, and seem set to decline against a background of rising inflation and global competition; this, plus an interest rate correction, might strengthen the downward trend for house prices.

In short, successive governments have failed to repair our economic structure, and bear market rallies notwithstanding, I think we must eventually recalibrate our measures of normality.

Thursday, October 23, 2008

A credible, horrible warning

In a fearsome, plain-speaking guide to the long-standing debt problem, Karl Denninger explains why he believes we are now in dire crisis. If the insolvent continue to be bailed out with money that the government itself must borrow from elsewhere, the American government's own credit will be destroyed. And non-Americans are in an even worse plight, in fact may trigger the explosion:

We may be days away from an international credit incident originating outside of the United States. Foreign nations, banks, and businesses have "levered up", or taken more risk, than we have. They too have chosen to lie.

This will hammer the stockmarket:

You have already seen nearly half of your money disappear.
You could see another half disappear - within days.

This is an implication of the graph I did on Sunday (see below), looking at the Dow adjusted for CPI inflation since 1928. A return to 4,500 points would seem to be reversion to the long-term norm - but to have it happen all at once, from its peak last October, is a scary prospect.


UPDATE

Tyler concurs, with respect to the UK economy, because of our dependence on income from financial services and associated services:

"Brown's boom was built on a group of industries that are now facing an Almighty bust..."

Sunday, October 19, 2008

Do-it-yourself Dow prediction

I've battled Windows Vista to produce the above graph, which takes the Dow at the beginning of October each year from 1928 on and adjusts it for CPI.

The red dot is where we were on Friday; some are saying it could hit 6,000 or 4,000, also indicated (adjusted for CPI as at the end of September 2008).

The question is, how much of the fantastic gain of the past 20 years or so will be undone, and over what period? Where would you say we "ought" to be? (Not that Mr Market cares, obviously.)


Connect up the lows of the early 30s and the 70s and extend the line, and you get what? An implied 2,500 or so. Connect up the highs of 1929 and the 50s and extend the line, and you end up about where we were at the start of this month, nudging 11,000.


"Faites vos jeux, Mesdames et Messieurs." Too rich for me, I think.

UPDATE

Karl Denninger is now talking about the S&P 500 falling to 500 points, a level it first broke above in March 1995; this would mean a further c. 50% drop from its close on Friday.

And he gives his reasons (plausible to me) why the American economy is in worse shape to overcome the setback, than it was in the 1930s.

Are we headed for the Red Pond?


Wednesday, October 15, 2008

We're back to last Thursday

The Dow has closed at 8,577.91, 733.08 off its start today. My amateur trend-drawing suggests that it's now back into its midstream; but then there's often an overshoot.

However, for those who do have money and also a long view, maybe it's not a bad price.

Tuesday, October 14, 2008

Cassandra couldn't run Troy

Thanks to Michael Panzner at Financial Armageddon, we can read for free an interview with 70-year-old money manager Jeremy Grantham. Grantham points out that business is run by managers, not by Old Testament prophets, and so he philosophises that crises will recur.

He also believes that this one isn't over yet:

The terrible thing -- after all this pain -- is that the U.S. equity market is not even cheap... it started from such a high level in 2000 that it still has not yet worked its way down to trend, although it is getting close. But the really bad news is that great bubbles in history always overcorrected. So although the fair value of the S&P today may be about 1025, typically bubbles overcorrect by quite a bit, possibly by 20%. That is very discouraging.

My 26 June guess at the trend for the Dow was c. 7,000 - 10,000:

If that means a midpoint of 8,500 and the overcorrection is 20%, then the momentary low point could be around 6,800, which at least suggests that the gap between my two red lines is approximately correct.

Friday's lowest point during the day was 7,773.71, still 10% away from the theorised minimum; and the Dow closed at 8,451.19. Yesterday it remained above the latter figure throughout, and rose to 9,387.61.

In short, Grantham must be reading this as a bear market rally, and it's not very silly to think that the Dow could come back to 7,000 at some point.

Good luck to the day traders, I haven't the nerve and speed to try to make a fortune on the bucking-bronco stage of the market.

Monday, October 13, 2008

Dow falls are only at interim stage


Jesse relays a couple of charts from Steve Williams at CyclePro, and adds one of his own. As I read it, the implication of the CyclePro charting is that the end-point for the Dow at the bottom of the bear market could be around half its present value, in a process that might take 8-10 years.

Jesse's chart relates the Dow to the price of gold, and the implication of his is a drop of some 60% - but that could be achieved by a rise in gold, as well as a fall in the Dow.

Perhaps it is time for us to be making quiet, regular withdrawals from the cashpoint and building up a stash of truly instant-access cash. I shall start today.
And when inflation hits?

Sunday, October 12, 2008

Derivatives blowup may hit insurance and car makers

This blog looks at the implications of failed investment bank Lehman's call on their "insurance" in the form of derivatives contracts. If everyone can handle the the cash call when it comes, good; if not, maybe a domino effect - one failure unbalancing another in a chain reaction. In particular, will hedge funds , who tend to play with borrowed money, be able to honour their contracts, or will they be the weak link in the chain?

Next up, says "George Washington", are the insurance and auto companies. It seems Standard & Poor's fear these could be the last days for GM and Ford.

I'm given to understand that players in derivatives usually balance their position with bets both ways; but they tend to be big bets. It's like a seesaw with an elephant at each end: if one elephant steps off, or turns out to be a baby compared to the other... What's the chances of $55 trillion of derivatives being well-balanced at all points?
So there are good reasons to think that next week is going to be more exciting than most of us would wish. Friday's Dow volatility may be repeated.

Friday, October 10, 2008

Guessing the low points

I looked at trends in the Dow earlier this year and guessed that the Dow's low might be 7,000. Now, Mish reports that Nouriel Roubini is saying the same.

The FTSE is currently hovering around 4,000, which is lower than the line I drew in June. But then, the line passed through, not under, the lowest negative spike in 2003. I seem to recall Wolfie predicting 4,000 in one of his comments here recently; well done, old chap.

Monday, October 06, 2008

FTSE and Dow predictions revisited

The FTSE is standing (if that's the right word) at 4,732 (13:50 BST, 08:50 ET). It seems to be edging towards the region I guessed at on 26 June this year. It had closed the day before at 5,666.10 and I said this:

I suggested on Wednesday that the market may already have lost much of its bubble, considered in real terms, and here below is my simple attempt at chartism.

What I've done is to draw two purple lines, one connecting the lows in the mid-80s/early 90s, and the other the highs in the same period. I've chosen that time-frame because it's before the silliness of the late 90s, and it does also include a period when the UK economy was in the doldrums.

Using these parameters, the late 90s and early 00s were well above trend, whereas last year's highs only just peeped above the upper line and the current value is hovering a little above the centre of the hi-lo wedge.

The implications are that the next low, if it comes soon, shouldn't be worse than around 4,500, and by 2010 (when I'm guessing the tide will turn) the bracket would be in the 4,700 - 7,000 bracket, with a midpoint of c. 5,850.

Taking the market at close yesterday and extrapolating to that 5,850 midpoint, would imply a future return (ignoring dividends) over the next 16 months, of c. 2.5% p.a. - not nearly as good as cash, especially in an ISA. On the same assumptions, to achieve an ex-dividend return of 6% p.a. would require entry into the market at c. 5,400.

On this tentative line of reasoning, we should be looking for a re-entry opportunity somewhere in the 4,500 - 5,400 level, say 5,000. Shall we wait for the next shoe to drop?

How bearish are you? Too much so? See the poll in the sidebar.

By the way, I did a similar exercise for the Dow the next day and it suggested to me that the range should be 7,000 - 10,000.

UPDATE

I'm in good company:

Mr Lenhoff [chief strategist at Brewin Dolphin] predicted that the FTSE 100 could settle between 4,500 and 4,600: "In this bearish phase the market has given up more than 50pc of the bull market gain, we are back where we were in early 2004. One of the key retraceable levels is thought to be two-thirds of a bull-market gain, which would be between 4,500 and 4,600. The market looks like it wants to give up the gain."

Friday, October 03, 2008

Well, you got what they wanted


The Saviour Bill is passed, and with a sigh of relief, the Dow... DROPS 157 points, as the dealers begin to realize that 200m American taxpayers have shelled-out $3,500 each for nothing at all. Look at the "panic" on Monday when the Bill was thrown out, and the "joy" now.


Tuesday, September 30, 2008

Boing!

Dow and FTSE back up again. Thought so. But unlike 1987, I don't think this will be over by Christmas. Bear market rally, don'tcha know?

Super post by Denninger today, too. He points out, among other things, that the Dow started falling yesterday when everyone (himself included) expected the Bill to pass. And as he says, Bernanke upped the money in the system by vast amounts anyway, and it still hasn't fixed the problem. Just how much petrol do you need to throw onto a fire to put it out?

Wednesday, September 24, 2008

Diary of a mayfly day trader

Wait! I was wrong! The Dow is up 32 points (09:42 EST)! Buy, buy! We've turned the corner! I am renaming this blog Bullwatch!

Oh no, only 14 points now (09:44 EST). Hold. Or maybe sell - over 50% of gains lost in only TWO MINUTES, goodness knows what could happen in a whole hour. Yes, sell! Sell!

Gosh, this is hard. Think I'll watch the TV news, they know what's going on.

UPDATE

OMG, down 32.42 (10:13 EST)!! In only 43 minutes! Over a 7-hour day that means 633.32 off the Dow!!

No, make that "!!!"

And there's another two days to go!!! !!! !!!

However could Mouton de Rothschild stand the tension?!!??

Tuesday, September 23, 2008

Bear market rally blues

Dow 18 Sept: 11,019.69
Dow 19 Sept: 11,388.44
Dow 22 Sept: 11,015.69
Dow 23 Sept: 10,854.17

Inspired by Nick Drew's bardic effusions, I offer a pastiche of Lonnie Donegan:

Does your equity lose its value
On the market overnight?
If your broker says don’t do it
Do you buy loads more in spite?
Can you hedge it with short selling?
Can you get the timing right?
Does your equity lose its value
On the market overnight?

Monday, September 22, 2008

Wall Street is waking up

The Dow has just dropped to 4 points below where it closed last Thursday; the 368-point sigh of relief it gave on Friday has been replaced by slightly sharper take of breath. It seems the equity traders are beginning to understand the details of the toxic buyout "solution". The rest of this week should be interesting.