Wednesday, July 08, 2009
An astrologer writes
Russell Grant is trenchant in his criticism of feckless governments and financial advisers.
Next market peak due in... 2018 - if society's still around by then
See here. Back in November, I figured that inflation-adjusted Dow took 16 years to decline from 1966 to 1982, and my guess is that we're on a similar inflation-fuelled ride, so starting with the last peak in 2000, we might think about hitting bottom in real terms in 2016.
On the other hand, history doesn't repeat, it rhymes. In 1966 China was... a disaster area. The world economy is much more interconnected now, and the tide is Eastwards, and big business is global. The company you invest in, if US or UK-based, may still be making good profits on its overseas earnings, even if domestic workers are all on the dole.
A recovery for the investors may happen sooner, and the market bottom may not be so deep in nominal terms (currency-adjusted is something else: look at what has happened to the dollar and pound; and what may yet happen). I think there's a big disconnect between the markets and Joe Average, since the extra wealth from 1980 on has mostly accrued to the top layer of society.
The concentration of money into fewer hands means that investment issues must inevitably give way to considerations of maintaining (repairing) the social and political fabric of our democracies.

Sunday, July 05, 2009
Where did the funny money go?
A few days ago, I charted American public debt in the 2oth century. I also wrote to the Spectator (they didn't publish) to point out that Ronald Reagan and the Bushes were far from conservative when it came to fiscal matters, and that this did not result in benefit to the average American.
Now I come across a graph that makes it plain:
Now I come across a graph that makes it plain:
 I suppose much the same happened here in the UK. So that's why we got all those posh-cooking and property-in -Provence TV programmes. We were encouraged to dream about the top echelon, not try to join them. As Eva Peron said, "I am taking the jewels from the oligarchs for you"; but somehow we never got to wear them ourselves. Not unless we went into hock for them.
This Wiki entry on the Gini coefficient remarks "Overall, there is a clear negative correlation between Gini coefficient and GDP per capita; although the U.S.A, Hong Kong and Singapore are all rich and have high Gini coefficients." Perhaps there is going to be a reversion to the standard international model: a poorer USA with a high Gini coefficient. Or (same source) a reversion to the social stratification of 1929:
"Gini indices for the United States at various times, according to the US Census Bureau:
1929: 45.0 (estimated)
1947: 37.6 (estimated)
1967: 39.7 (first year reported)
1968: 38.6 (lowest index reported)
1970: 39.4
1980: 40.3
1990: 42.8
2000: 46.2
2007: 46.3"
This blog projects a Gini convergence between the USA and Mexico - perhaps it makes sense, on the reversion-to-mean basis: 
Friday, July 03, 2009
The sun also rises
... the governance of Britain which as we have said is semi-feudal, ruled by a few corporations and the wealthy elite in partnership with essentially a one party government.This will go a long way in helping to understand the "British disease" of economic stagnation. You start by crippling the middle class through debt indebtedness to a corporate elite.
So sorry, an error in transcription: for Britain and British, I should have written Japan and Japanese. Gomen nasai. But an understandable mistake, you may think. How much difference will a regime change in the UK make? The inclusion of Ken "fags and Bilberberg" Clarke on the Opposition team seems a deadly marker to me.
Returning to our muttons... Jesse has been focusing on the Land of the Rising Sun recently. He's pointed out that an ageing demographic structure is a major brake on the economy, especially with tight controls on immigration (though we in the UK may have have drawn the wrong conclusion from this); and today he looks at how the Japanese have organised themselves to reduce energy costs and oil dependency.
Especially the car: "I have long thought of cars as vampires sucking the economic life out of every household in the US. And the risk of death and serious injury from car accidents is about half what it is in the US (although the statistics may not be directly comparable)." And considered from a coldly economic point of view, think of the enormous overall costs of those deaths; and the possibly far greater costs of medical care and other support for the vast and growing army of injured and permanently disabled.
 It's well worth reading the whole letter from Jesse's friend in Japan - not just about energy, but preventive healthcare etc. They walk to McDonald's - not waddle. They're organising themselves; so can we.
 Thursday, July 02, 2009
Faber: correction, then inflation
Cash for now, while we wait for the second half selloff; then stocks and gold to hedge against inflation, says the good Doctor.
Dow 400?
Tim Iacono quotes the Elliott Wave people:
For the record, EWFF also shows a "grand supercycle," beginning in January 2000 and ending at 400. Yes, that was FOUR HUNDRED.
And I thought I was being Eeyorish at 2,000.
For the record, EWFF also shows a "grand supercycle," beginning in January 2000 and ending at 400. Yes, that was FOUR HUNDRED.
And I thought I was being Eeyorish at 2,000.
Approaching the three-day week?

Wednesday, July 01, 2009
Market support
 Denninger:
... a handful of banks, most specifically Goldman Sachs, constitute the majority of NYSE trading volume... This "back and forth trade" between a handful of institutions is nothing more than the old "pump and dump" game that has been played in the OTC market forever - and almost always screws the individual investor.
This is no different than you and I selling a house back and forth between us repeatedly, each time at a higher price. We both appear to be geniuses as we're both making a "profit", right?
Well, no. One of us is destined to take a horrifying loss if we do not find a sucker to make the final transaction with.
I wondered what was keeping it all up. And sooner or later...
P.S. Rob Kirby strongly suspects that similar manipulation is going on in oil and gold - one kept up, the other down. (For an update on the latter, click on the goldcam.)
Tuesday, June 30, 2009

Sunday, June 28, 2009
Another letter to The Spectator
Sir:
Irwin Stelzer (“No more consensus: this time there is a choice”) holds up Ronald Reagan as a model of a Conservative working for the ordinary voter. He could hardly have chosen a worse exemplar.
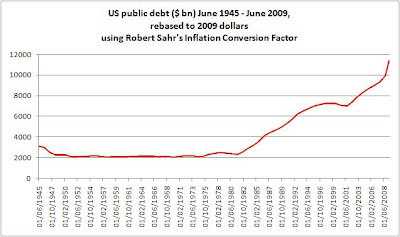
From 1947 to 1981 (the year in which Jimmy Carter left, and the Great Communicator took office), US public debt outstanding had fluctuated between $2 – 2.5 trillion (inflation-adjusted to 2009 dollars). Carter ended his Presidency with the debt no worse than it had been when he began. Under Reagan, the debt doubled in real terms (average 9.7% p.a. increase). Bush senior continued this trend (7.3% p.a.); the next two terms under Clinton showed a significant slowing (1.8% p.a.); but Bush junior picked up the pace again (6.3% p.a.) America now has $11.4 trillion public debt around its neck, approximately 5 times the equivalent in 1980, when Reagan asked voters, “Are you better off than you were four years ago?”
Well, how much better-off is Joe Average now? In the latest issue of Harvard Business Review, Gary Pisano and Willy Shih conclude that “average real weekly wages have essentially remained flat since 1980.” Instead, the “trickle-down effect” has turned out to be a torrent for the upper stratum only: in a 2006 speech reviewing hourly wage rate increases from 1973 – 2005, the economist Janet Yellen, of the Federal Reserve Bank of San Francisco, said “... the growth was heavily concentrated at the very tip of the top, that is, the top 1 percent”. The rest played catch-up by taking on extra personal debt: an investment analyst quoted in The Economist (22 January 2009) says “... the share of household and consumer debt alone went up from 100% of GDP in 1980 to 173% today, equivalent to around $6 trillion of extra borrowing.” Naturally, this process was much to the advantage of bankers, brokers and others in the top 1%.
In short, America has been pretty nearly busted by and for its elite. So much for the party of smaller government; so much for supporting the core Conservative, hard-working average wage-earner; not so much clear blue water, as a tide of red ink. One can only hope that the next British Conservative government, if there is one, will seek not to emulate Reagan and the Bushes.
Yours,
Irwin Stelzer (“No more consensus: this time there is a choice”) holds up Ronald Reagan as a model of a Conservative working for the ordinary voter. He could hardly have chosen a worse exemplar.
From 1947 to 1981 (the year in which Jimmy Carter left, and the Great Communicator took office), US public debt outstanding had fluctuated between $2 – 2.5 trillion (inflation-adjusted to 2009 dollars). Carter ended his Presidency with the debt no worse than it had been when he began. Under Reagan, the debt doubled in real terms (average 9.7% p.a. increase). Bush senior continued this trend (7.3% p.a.); the next two terms under Clinton showed a significant slowing (1.8% p.a.); but Bush junior picked up the pace again (6.3% p.a.) America now has $11.4 trillion public debt around its neck, approximately 5 times the equivalent in 1980, when Reagan asked voters, “Are you better off than you were four years ago?”
Well, how much better-off is Joe Average now? In the latest issue of Harvard Business Review, Gary Pisano and Willy Shih conclude that “average real weekly wages have essentially remained flat since 1980.” Instead, the “trickle-down effect” has turned out to be a torrent for the upper stratum only: in a 2006 speech reviewing hourly wage rate increases from 1973 – 2005, the economist Janet Yellen, of the Federal Reserve Bank of San Francisco, said “... the growth was heavily concentrated at the very tip of the top, that is, the top 1 percent”. The rest played catch-up by taking on extra personal debt: an investment analyst quoted in The Economist (22 January 2009) says “... the share of household and consumer debt alone went up from 100% of GDP in 1980 to 173% today, equivalent to around $6 trillion of extra borrowing.” Naturally, this process was much to the advantage of bankers, brokers and others in the top 1%.
In short, America has been pretty nearly busted by and for its elite. So much for the party of smaller government; so much for supporting the core Conservative, hard-working average wage-earner; not so much clear blue water, as a tide of red ink. One can only hope that the next British Conservative government, if there is one, will seek not to emulate Reagan and the Bushes.
Yours,
Saturday, June 27, 2009
Down
Read Brad Setser on the USA's deterioration in the net international investment position.
The left-hand scale is in $billions.
To quote Status Quo, "down down, deeper and down".

The left-hand scale is in $billions.
To quote Status Quo, "down down, deeper and down".

Thursday, June 25, 2009
Cash vs the stock market: an inconvenient truth
Tuesday, June 23, 2009
Inflation, not deflation
Jesse today, maintaining that inflation can indeed happen...
Our own view is that a serious stagflation with further devaluation of the US dollar as it is replaced as the world's reserve currency is very likely, after a period of slackening demand and high unemployment. A military conflict is also a probable outcome as countries often go to war when they fail at peace.
Tips?
From my own readings in this area, the people who tended to survive the Weimar stagflation the best were those who:
1. Owned independent supplies of essentials including food and shelter and were reasonably self-sufficient.
2. Had savings in foreign currencies that were backed by gold such as the US dollar and the Swiss Franc
3. Possessed precious metals
4. Belonged to a trade union and/or had essential skills or government position which guaranteed a wage
5. Were invested in foreign equity markets, and even in the domestic German stock market for a time
Sunday, June 21, 2009
US public debt since 1945 - inflation-adjusted
Sources: Treasury Direct, Robert Sahr. Click to enlarge.
Presiding over indebtedness... or as helpless as King Canute?


Presiding over indebtedness... or as helpless as King Canute?

A samizdat on Europe
How many Internet users in the UK, with their own printer at home or permitted some private use at work?
Why can we not design and post up a form - a petitition for a referendum, for printing-off and taking round for signing by work colleagues, friends and neighbours? With a request that everyone follows suit - downloads, prints, distributes and posts into a central address?
Or even an unofficial, but fairly-worded referendum itself?
Or are we indeed "entering a post-democratic age?"
So, never mind the Lisbon Treaty, that sly strategy to get us into the bedroom on some basis other than the consummation of marriage? Is it not time to seek democratic legitimation of the UK's membership of the EU per se?
Why can we not design and post up a form - a petitition for a referendum, for printing-off and taking round for signing by work colleagues, friends and neighbours? With a request that everyone follows suit - downloads, prints, distributes and posts into a central address?
Or even an unofficial, but fairly-worded referendum itself?
Or are we indeed "entering a post-democratic age?"
Saturday, June 20, 2009
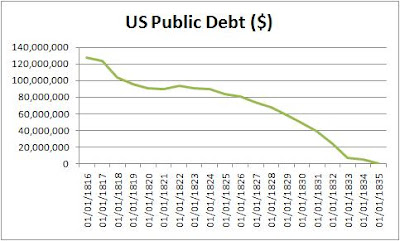
US Public debt vs. gold
Still trying to see the debt mountain in context... So let's see how hard it would be to pay off in gold, assuming that in 1791 a single "bag" of gold would have cleared the account.
For the first 70 years, the gold-priced public debt was always less than twice its 1791 level, and often below the starting point.
Now to see the progress of the public debt since 1860:
 ... and second, since 1945:

For the first 70 years, the gold-priced public debt was always less than twice its 1791 level, and often below the starting point.
Now to see the progress of the public debt since 1860:
 ... and second, since 1945:
These pictures seem to indicate the influence of:
(a) two world wars
(b) the closure of the "gold window" in 1971
(c) monetary expansion since the 1980s
(d) the Grand Bust of 2000, NOT 2007, and the consequent flight to commodities
- and on this way of measuring the catastrophe, we're 50% worse off than at the end of WWII - plus we're not rebuilding the economy, we're doing the reverse.
Glory days
How did they do it? How can we do it again?
 Perhaps staying out of wars, and quickly jailing greedy bankers, would be a start.
 Perhaps staying out of wars, and quickly jailing greedy bankers, would be a start.
Subscribe to:
Posts (Atom)