... and Robert McHugh figures that the US stock market (as measured by the Wilshire 5000 Index) has already lost $2.6 trillion in the last three months.
He's begging for inflation now, rather than a useless stimulant later when the mule has died.
Showing posts with label stockmarkets. Show all posts
Showing posts with label stockmarkets. Show all posts
Monday, January 21, 2008
Wednesday, January 09, 2008
Something's gotta give
Interest on official debt in the USA runs at $430 billion for 2007, and rising steeply, according to the Treasury's own figures (htp Michael Panzner, quoting Mish's Global Economic Trend Analysis); total government debt is now c. $9.2 trillion.
It's more serious than that, of course: James Turk quotes the Comptroller General, David M Walker's estimate that total liabilities, including commitments to future social security benefits, are around $53 trillion. The government's annual revenues are only around 5% of this figure, so the credit card looks like it's pretty much fully-loaded.
However it happens, it seems something must give way under the strain. Frank Barbera reckons the Dow has plenty further to fall (and possible interim correction or not, he thinks gold looks good). Prieur du Plessis concurs, quoting Nouriel Roubini's comment that "... a lousy stock market in 2007 will look good compared to an awful stock market in 2008."
Bob Bronson thinks the downturn will be long as well as hard. He in turn quotes the chairman of the National Bureau of Economic Research: this one “could be deeper and longer than the recessions of the past.”
Boris Sobolev also looks to gold, but prefers the smaller companies because of all the money that's piled into the majors.
In case we in the UK should be tempted by schadenfreude, Ashraf Laidi predicts that sterling will accompany the US dollar's fall against other currencies. From what I read in connection with the USA, a weakening currency may provide a temporary boost to exports, but also inflate the cost of imports; so I don't suppose that our following the dollar will do us much long-term good, either.
Of course, it's possible to dismiss all this as group-think wall-of-worry stuff, but maybe that would be double-bluffing ourselves. Sometimes, things are exactly what they seem. Banks have consistently turned a profit for centuries, on the inexorability of debt.
Thursday, December 27, 2007
Defensive investing
Michael Panzner's latest is lucidly entitled "Today's Lesson: Bad Economy = Bad Stock Market". At last, financial analysis I can understand.
I've never understood why the stockmarket seems serenely unrelated to the dire state of the economy. Supposedly the market "looks ahead" around a year, but it can't be seeing what I'm looking at.
Anyhow, Panzner reproduces Dan Dorfman's article in the New York Sun, which reviews what's happened to the market in past recessions and gives tips on strong defensive areas - booze, cigs and "household products". I can understand that, too - or the first two, at least.
Thursday, December 20, 2007
Hark what discord follows
David Galland rehearses the argument for gold. He points out that, relative to stocks, the gold market is so small that a small shift into it from stocks would massively inflate demand. Against that is the fact that it hasn't happened yet, and that a small market can also be manipulated downwards by suppliers, particularly the central banks. Besides, in a real panic, Joe Average isn't looking to make a killing in commodities, he's trying to pay bills in cash and buy food and fuel ditto. Nice area for speculators with quick reflexes, though.
What is inflation, anyway? Ronald Cooke looks at the damned lies and self-serving statistics that underpin the official Consumer Price Index.
Jim Patterson reads the stockmarket runes and concludes:
Sub-Prime issues have been discounted. With overall market returns compressed the downside is limited. We expect a better market in the weeks and months ahead.
In his slightly starchy prose, The Contrarian Investor agrees with Patterson, up to a point, but also gives a serious warning:
1. In today’s market, the probability of the market going up is higher than the probability of it coming down. Hence, it is rightly called a bull market.
2. But should it come down (which is unlikely), it can collapse at extremely great speed and magnitude.
Hence, the stronger and longer this uptrend continues, the greater in magnitude and speed (as in volatility, not timing) the Great Crash III will be. Hence, the coming Great Crash III is a Black Swan event—an improbable but colossal impact event.
The importance of a particular event is the likelihood of it multiplied by its consequences. Black Swan events are events that are (1) highly unlikely and (2) colossal impact/consequences. One common mistake investors (and many professionals) make is to look at the former and forget about the latter i.e. ignore highly unlikely but impactful events.
Therefore, when contrarians are preparing for a crash, it does not necessary mean that they are predicting doom and gloom. Rather, they see the vulnerability of Black Swans and prepare for them.
Saturday, November 24, 2007
Why the sea is salt, and why we are drowning in cash
We are said to be heading for a recession, so I had another look at Bank of England statistics for M4 - money supply as measured by private lending by financial institutions.
 And then there's the stockmarket. It doesn't seem to reflect the real state of the economy - until you shift the lines, when for example the S&P 500 turns out to be a fair predictor of changes in GDP, as shown in a graph in a 2005 entry from this blog ("Capital Chronicle", by RJH Adams):
 The same post also provides a brilliant graph of a measure of fair value for investors, known as Tobin's Q. Look at the wonderful opportunities presented by two world wars and the economic shock (blamed on oil prices, but maybe the causality is the wrong way round) of the 70s:
Since June 1963, there has NEVER been a quarterly period when M4 contracted. In fact, here are the only times in the last 44 years when UK quarterly monetary inflation ran at less than 5% p.a. equivalent:
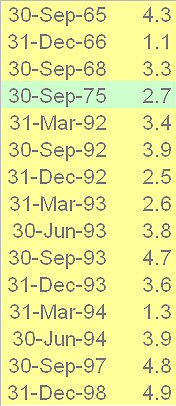 As you see, mostly it was the nineties, with one instance in 1975 and three times in the sixties. The average rate for the whole series up to December 2006 is 13.47%. So the hand-mill never stops grinding.
But should it? Wikipedia gives an account of recession and the Great American Depression, and notes that during the latter period the money supply contracted by a third. Great for money-holders, bad for the economy and jobs.
This page points out that we tend (wrongly) to think of a period of economic slowdown as a recession, and says that technically, recession is defined as two successive quarters of negative economic growth. By that measure, we haven't had a recession in the UK (unlike Germany) for about 15 years - here's a graph of the last few years (source):
And then there's the stockmarket. It doesn't seem to reflect the real state of the economy - until you shift the lines, when for example the S&P 500 turns out to be a fair predictor of changes in GDP, as shown in a graph in a 2005 entry from this blog ("Capital Chronicle", by RJH Adams):The same post also provides a brilliant graph of a measure of fair value for investors, known as Tobin's Q. Look at the wonderful opportunities presented by two world wars and the economic shock (blamed on oil prices, but maybe the causality is the wrong way round) of the 70s:
Nevertheless, it still feels to me (yes, "finance with feeling", I'm afraid) as though the markets are over-high, even after taking account of the effects of monetary inflation on the price of shares. And debt has mounted up so far that a cutback by consumers could be what finally makes the economy turn down. Not just American consumers: here is a Daily Telegraph article from August 24th, stating that for the first time, personal borrowing in the UK has exceeded GDP.
The big question, asked so often now, is whether determined grinding-out of money and credit can stave off a vicious contraction like that of the Great Depression. Many commentators point out that although interest rates are declining again, the actual interest charged to the public is not falling - lenders are using the difference to cover what they perceive as increased risk. Maybe further interest rate cuts will be used in the same way and keep the lenders willing to finance the status quo.
Some might say that this perpetuates the financial irresponsibility of governments and consumers, but sometimes it's better to defer the "proper sorting-out" demanded by economic purists and zealots. History suggests it: in the 16th century, if Elizabeth I had listened to one party or another in Parliament, we'd have thrown in our lot with either France or Spain - and been drawn into a major war with the other. We sidestepped the worst effects of the Thirty Years' War, and even benefited from an influx of skilled workers fleeing the chaos on the Continent. If only we could have prevented the clash of authoritarians and rebellious Puritans for long enough, maybe we'd have avoided the Civil War, too.
So perhaps we shouldn't be quite so unyielding in our criticisms of central bankers who try to fudge their - and our - way out of total disaster.
Saturday, November 17, 2007
Winter is the growing season
Following my search for predictable stockmarket patterns ("Real Cycles"), Joseph Dancy analyses the phenomenon of winter season investment growth. It seems that "sell in May and go away" is still good advice. Dancy quotes Mark Hulbert:
[The research] implies that simply going to cash between May Day and Halloween will have only minor impact on long-term returns while dramatically reducing risk -- a winning combination that would show up in a much improved risk-adjusted performance.
Until everybody does it, of course. But what are the chances of that happening?
Tuesday, November 13, 2007
Measuring relative value
Fiat currency is elastic - it stetches and contracts according to the demand for, and supply of, credit. So it is an unreliable tool to measure the value of anything.
George Kleinman addresses this problem and suggests a relativistic approach: compare the historical price ratios of different asset types. He admits that you can play this game forever, but it's not his fault that governments have corrupted our traditional yardstick. All you can hope for is some sense of trend, which is what all this rune-reading is for, anyway.
His conclusions: gold looks undervalued against oil, and not overvalued against either the Dow or silver. His trend feeling: a coming economic and stockmarket downturn.
Financial Sense may be run by investment advisers, but I feel their commitment to public education goes well beyond self-interest. It's a sort of University of the Air.
Tuesday, October 30, 2007
Every Picture Tells A Story

My brother sent me this. Just imagine what it would look like if the chart wasn't using a logarithmic scale. Which way from here?
Monday, October 29, 2007
... and the brakes have been greased
 How to stop a car without brakes
Further systemic risk. Jim in San Marcos comments on changes at the New York Stock Exchange, which has completed its conversion to electronic trading and has now removed some safety checks that were designed to reduce volatility in extreme conditions.
He says that a change in sentiment (perhaps initially caused by an error) could now lead to a much more rapid drop on the markets, since pension funds and investment companies are also using programmed trading.
Trouble ahead

Market Ticker reports that a bank has borrowed $75 million at exceptionally high interest rates, suggesting that the collateral they were offering wasn't sound enough to be acceptable. And there are futures contracts being taken out that indicate some traders expect a major financial dislocation.
In other words, this bet is one that the credit markets will go supercritical.
And it wasn't made by just one firm, one speculator, or one guy.
A few months ago I pointed out that every big equity market dump - every last one of them - has started in the credit markets. It always starts there, simply because of the volume of business transacted and the sensitivity to problems. In the equity markets one company can go "boom" and it doesn't mean much. But in the credit markets "systemic risk" - that is, a refusal to trust people as a foundational principle - once it takes hold is very, very difficult to tamp back down.
Read the whole post here. And here's the evidence (source):

Tuesday, August 28, 2007
The money supply, the stockmarket, gold and land
Here's part of an interesting interview with a hedge fund manager in 2003, reproduced in October 2005:
An old interview with Hugh Hendry (2003)
Hendry: What's happening today happened 300 years ago in the French economy when John Law, another Scotsman, was allowed to launch the first government-sanctioned bank, which replaced coins with paper money. Commerce boomed. Politicians recognized this correlation between issuing more money and people liking you. They issued more and more money, but it was a false promise. Nothing intrinsically was being added to the economy except promises, which could never be redeemed. Selling by speculators caused the stock market to correct. The correction encouraged the authorities to print more funny money. Ultimately, the continued pumping of liquidity destroyed the economy, the stock market and France's currency.
More recently, the U.S. came off the gold standard in 1971 and the Dow Jones Industrial Average bottomed in 1974. Over the next 25 years, the Dow goes up 20-fold because every period of economic anxiety brought forward an orthodoxy of generous liquidity. Money has to go somewhere. It seeks to perpetuate itself by going into a rising asset class. This time, it is financial assets. Just like the Mississippi stock scheme in 1720 and the South Sea Bubble in London at the same time.
Hugh Hendry set up Eclectica Asset Management in 2005 and like others I've mentioned before, seems to have discovered an enthusiasm for agriculture; Eclectica's new Agriculture Fund is detailed here.
Elections, inflation and the stockmarket
Here's an interesting 2005 piece from British home lender / banker HBOS/Halifax, correlating periods of government with inflation and share prices. The conclusion:
Martin Ellis, chief economist at Halifax, said:
"Although wider economic conditions clearly play a part in the rise and fall of the stock market, election campaigns do appear to have a marked impact on share prices. The three month period preceding any general election traditionally sees large fluctuations in share prices as the market tries to understand the likely outcome of the election."
I haven't yet tried to relate increases in the money supply to General Elections, but it might be an interesting avenue to explore.
Friday, August 17, 2007
Following the markets today

As I hoped and more than half expected, the major Western markets are recovering from some of their fright. The FTSE has passed 6,000 again and at the time of writing, the Dow is back above 13,000. Those chest pains will eventually be laughed off as a bout of indigestion, and it'll be back to the fags and booze after a while.
The subprime mess was well-telegraphed, if ignored by many, and although we still don't know the full cost, it seems that yet again, the central banks are willing to pump money into the system, rather than reform it. Marc Faber's view that the crisis should be allowed to burn through and eliminate some of the players, is too gritty for the banking establishment.
My take on this is that it's an opportunity for those still in the market to quietly come out without panicking everybody else. The rise of the dollar and the temporary sharp falls in precious metals, are reminders that in a crisis, cash is king; though given Ben Bernanke's statement about dropping dollars from helicopters, maybe king for a day.
Friday, August 10, 2007
It's an ill wind... Marc Faber cheers up
 As the stockmarkets gyrate, Marc Faber is still optimistic about Asian real estate. Tientip Subhanij, in today's Bangkok Post, says:
The optimism over Asian property has been tested in recent months following the volatility in the global equity markets. The woes of the US sub-prime market have already started to shake confidence. Experts have predicted a major crash in US real-estate prices that would trigger defaults and spread the contagion to most emerging markets.
Many with true faith in Asian property, however, dispute any suggestion of an overheated market in the region. Their contention is that the party has just started for regional property, given that prices in many areas have yet to exceed the peaks they achieved before the Asian financial crisis in 1997.
Marc Faber, the well-known author of Tomorrow's Gold: Asia's Age of Discovery, also believes that while stock markets are vulnerable, Asian real estate presents tremendous opportunities. He thinks that most property assets in Asia are still far below their pre-1997 highs.
Thursday, August 09, 2007
Subprime worrying Europe
 Looking at the German stock exchange (^GDAXI in the sidebar widget), the market has opened lower. For Reuters comment, see here.
UPDATE (10.08 a.m.)
The FTSE is looking skittish, too. As Reuters reports: "Richard Hunter, head of UK equities at Hargreaves Lansdown [says], "... as a general rule of thumb, we've certainly been following (Wall) Street on the way down although not necessarily on the way up."
Friday, August 03, 2007
Official market intervention?
Interesting quote from today's Daily Reckoning Australia:
Meanwhile, is the Plunge Protection Team (PPT) hard at work in the US? For the second day in a row, Wall Street rallied over 100 points in the last hour of trading.
You can interpret this in one of two ways. First, bulls and bears are earnestly engaged in combat for control of the market. Bears are winning the field for most of the day, with the Bulls rallying late.
The other, more sinister theory is that there exists in the financial market a buyer of last resort who comes in to goose the indexes at critical times, when investor confidence is especially fragile. We take no position on the matter. But it sure does look weird on a chart.
This could be connected up with the UK's surge in US Treasury security purchases over the last year. The conspiracy theory here would then be that the plane is already in trouble, and the stewardesses (I've forgotten the PC term) are walking the aisles to reassure the passengers.
Time to take gains?
Tuesday, July 31, 2007
Dow value afterthought
...and if we remember the heady close of December 1999, before tech stocks burst, the Dow was then at 11,497.12. We've had 7 years and 7 months elapse since, with an average growth of just under 2% compound per year. Adjusted for inflation (or available bank deposit interest rates), we've actually fallen behind; or, from a different point of view, we're not so wildly overvalued.
Actually, what I suspect has happened is that the balloon has a tear in it, and has been kept from falling to earth by massive amounts of extra monetary hot air; but "in real terms" we're still stuck somewhere in 1999. In short, we haven't yet faced up to the problems of our economy.
To use a different analogy, we're still drinking, in order to put off the hangover. But maybe there's lots more "booze" left (i.e. the Fed's printing press, aped by the Bank of England and others) and our "livers" (the real economy of production and jobs) will hold out a while longer.
It's not a strategy I'd recommend. I wonder what you think.
What should the Dow Jones be worth?
The Dow closed yesterday at 13,358.31; ten years before, it stood at 8,254.89. That's a compound annual growth rate of 4.93% (less, when you adjust for inflation).
Or if you take it from the big, big scare of Monday 19 October 1987 (close: 1,738.74, down 508 points from the previous Friday!), it's an average 10.88% compound per year. Does that seem too hot a pace? Unsustainable? But remember that we're starting that run from a real panic. If we took it from the happy close of the Friday before, the average becomes 9.53%.
Still too hot? If nearly 20 years isn't enough to establish a sensible long-term trend, let's look at an even longer period: 30 years from 30 July 1977. Then till now, the Dow's capital growth averages out at 9.45% compound per year. The market's folly can outlast your wisdom.
"Two views make a market", and that's it. Mr Market is making his wares available to you - will you buy at today's prices? (I wouldn't - but obviously others will, or the market would be lower.)
You can play with the figures yourself, on this fine page from Yahoo! Finance.
And please click on the poll opposite, to give your prediction for the year's end.
Saturday, July 28, 2007
Peter Schiff: US Treasury less creditworthy
Peter Schiff in FXStreet today mounts a vigorous defence of his record of warning us that subprime problems would spill over into other credit areas. The market appears to be waking up to this, but he says there's worse to come:
A much larger disaster looms for holders of U.S. dollar denominated assets in general. It will not be long before our foreign creditors realize that Uncle Sam is the biggest subprime borrower of them all and will similarly mark down the value of its debts as well.
Once again, why has Britain recently become the third-largest holder of American debt? Our exposure is now 3 times higher than about a year ago.
Friday, July 27, 2007
October 1987 revisited
I'm trying to work out whether making an historical analogy with 20 years ago is valid.
Let's have a look at what has happened to prices. Cliff D'Arcy in The Motley Fool (22 May 2007) does a very informative comparison between houses and the FTSE 100. He reminds us that although the FTSE-100 dropped dramatically on "Black Monday" (19 October 1987), it ended about 2% higher over the year as a whole. If we take his figures for 1987 to 2006, house prices increased 287%, and the FTSE 263%. This would suggest that house prices and stock prices have increased about equally (though houses cost money to run, whereas shares pay dividends).
Are British people over-borrowed? This Bank of England research document from September 2004 says not, in relation to house prices. Yes, debt-to-income has gone up, but interest rates are now low. And despite its name, the latest survey from UK site HousePriceCrash indicates a general belief that house prices will continue to rise in the months ahead. (But recent first-time buyers will be more vulnerable, having little equity and probably a high income multiple for their loan.)
I find the monetarist arguments intuitively persuasive, but I'm puzzled by the disparity between prices and monetary inflation. Using the UK's M4 stats, over the 78 quarters from Dec 1987 to March 2007, the average annualized increase in the money supply is about 10.48%. Compounding that figure, we get about 7 times more borrowed money in the system today than in 1987. Yet houses and shares are only 3-4 times higher.
What does seem clear is that we have borrowed more in relation to income, and this makes it even more important not to lose your job, or be hit by high interest rates. It's worrying when you have to depend on things carrying on as they are, indefinitely.
Subscribe to:
Posts (Atom)