Thursday, October 03, 2013

John Cook's Climate Change Mythbusters 16

This is part of a series reposting material from John Cook's Skeptical Science website. Although he is a physicist rather than a specialist in climate science, he is a convinced "global warmist" and tries to rebut frequently-raised objections to the theory. However, it is always possible to question the data (e.g. this valuable note about measuring temperature) and the line of argument. Please help advance the debate - with facts and logic.
_______________________________________________________

What evidence is there for the hockey stick?

What The Science Says:
Since the hockey stick paper in 1998, there have been a number of proxy studies analysing a variety of different sources including corals, stalagmites, tree rings, boreholes and ice cores. They all confirm the original hockey stick conclusion: the 20th century is the warmest in the last 1000 years and that warming was most dramatic after 1920.
Climate Myth: Hockey stick is broken
“In 2003 Professor McKitrick teamed with a Canadian engineer, Steve McIntyre, in attempting to replicate the chart and finally debunked it as statistical nonsense. They revealed how the chart was derived from "collation errors, unjustified truncation or extrapolation of source data, obsolete data, incorrect principal component calculations, geographical mislocations and other serious defects" -- substantially affecting the temperature index.” (John McLaughlin)
The "hockey stick" describes a reconstruction of past temperature over the past 1000 to 2000 years using tree-rings, ice cores, coral and other records that act as proxies for temperature (Mann 1999). The reconstruction found that global temperature gradually cooled over the last 1000 years with a sharp upturn in the 20th Century. The principal result from the hockey stick is that global temperatures over the last few decades are the warmest in the last 1000 years.


Figure 1: Northern Hemisphere temperature changes estimated from various proxy records shown in blue (Mann 1999). Instrumental data shown in red. Note the large uncertainty (grey area) as you go further back in time.

A critique of the hockey stick was published in 2004 (McIntyre 2004), claiming the hockey stick shape was the inevitable result of the statistical method used (principal components analysis). They also claimed temperatures over the 15th Century were derived from one bristlecone pine proxy record. They concluded that the hockey stick shape was not statistically significant.

An independent assessment of Mann's hockey stick was conducted by the National Center for Atmospheric Research (Wahl 2007). They reconstructed temperatures employing a variety of statistical techniques (with and without principal components analysis). Their results found slightly different temperatures in the early 15th Century. However, they confirmed the principal results of the original hockey stick - that the warming trend and temperatures over the last few decades are unprecedented over at least the last 600 years.


Figure 2: Original hockey stick graph (blue - MBH1998) compared to Wahl & Ammann reconstruction (red). Instrumental record in black (Wahl 2007).

While many continue to fixate on Mann's early work on proxy records, the science of paleoclimatology has moved on. Since 1999, there have been many independent reconstructions of past temperatures, using a variety of proxy data and a number of different methodologies. All find the same result - that the last few decades are the hottest in the last 500 to 2000 years (depending on how far back the reconstruction goes). What are some of the proxies that are used to determine past temperature?

Changes in surface temperature send thermal waves underground, cooling or warming the subterranean rock. To track these changes, underground temperature measurements were examined from over 350 bore holes in North America, Europe, Southern Africa and Australia (Huang 2000). Borehole reconstructions aren't able to give short term variation, yielding only century-scale trends. What they find is that the 20th century is the warmest of the past five centuries with the strongest warming trend in 500 years.


Figure 3: Global surface temperature change over the last five centuries from boreholes (thick red line). Shading represents uncertainty. Blue line is a five year running average of HadCRUT global surface air temperature (Huang 2000).

Stalagmites (or speleothems) are formed from groundwater within underground caverns. As they're annually banded, the thickness of the layers can be used as climate proxies. A reconstruction of Northern Hemisphere temperature from stalagmites shows that while the uncertainty range (grey area) is significant, the temperature in the latter 20th Century exceeds the maximum estimate over the past 500 years (Smith 2006).


Figure 4: Northern Hemisphere annual temperature reconstruction from speleothem reconstructions shown with 2 standard error (shaded area) (Smith 2006).

Historical records of glacier length can be used as a proxy for temperature. As the number of monitored glaciers diminishes in the past, the uncertainty grows accordingly. Nevertheless, temperatures in recent decades exceed the uncertainty range over the past 400 years (Oerlemans 2005).


Figure 5: Global mean temperature calculated form glaciers. The red vertical lines indicate uncertainty.

Of course, these examples only go back around 500 years - this doesn't even cover the Medieval Warm Period. When you combine all the various proxies, including ice cores, coral, lake sediments, glaciers, boreholes & stalagmites, it's possible to reconstruct Northern Hemisphere temperatures without tree-ring proxies going back 1,300 years (Mann 2008). The result is that temperatures in recent decades exceed the maximum proxy estimate (including uncertainty range) for the past 1,300 years. When you include tree-ring data, the same result holds for the past 1,700 years.


Figure 6: Composite Northern Hemisphere land and land plus ocean temperature reconstructions and estimated 95% confidence intervals. Shown for comparison are published Northern Hemisphere reconstructions (Mann 2008).

Paleoclimatology draws upon a range of proxies and methodologies to calculate past temperatures. This allows independent confirmation of the basic hockey stick result: that the past few decades are the hottest in the past 1,300 years.

All original material is copyright of its author. Fair use permitted. Contact via comment. Unless indicated otherwise, all internet links accessed at time of writing. Nothing here should be taken as personal advice, financial or otherwise. No liability is accepted for third-party content, whether incorporated in or linked to this blog; or for unintentional error and inaccuracy. The blog author may have, or intend to change, a personal position in any stock or other kind of investment mentioned.

Wednesday, October 02, 2013

The flash revolution of 2 October 2013

6pm: Following broadcast news reports of Mr Cameron's speech declaring Britain "a land of opportunity", 26 million employees immediately resign to become self-employed and plan to pay no tax for the next two years as they make the usual losses while creating their multinational businesses.

6.15 pm: Speaking from a television studio temporarily manned by police and Army personnel, the Prime Minster issues a correction, saying "We didn't mean you. Any of you. Now get back to work."

All original material is copyright of its author. Fair use permitted. Contact via comment. Unless indicated otherwise, all internet links accessed at time of writing. Nothing here should be taken as personal advice, financial or otherwise. No liability is accepted for third-party content, whether incorporated in or linked to this blog; or for unintentional error and inaccuracy. The blog author may have, or intend to change, a personal position in any stock or other kind of investment mentioned.

John Cook's Climate Change Mythbusters 15

This is part of a series reposting material from John Cook's Skeptical Science website. Although he is a physicist rather than a specialist in climate science, he is a convinced "global warmist" and tries to rebut frequently-raised objections to the theory. However, it is always possible to question the data (e.g. this valuable note about measuring temperature) and the line of argument. Please help advance the debate - with facts and logic.
_______________________________________________________

Ocean acidification: global warming's evil twin

What The Science Says:
Ocean acidification threatens entire marine food chains.
Climate Myth: Ocean acidification isn't serious
'Our harmless emissions of trifling quantities of carbon dioxide cannot possibly acidify the oceans. Paper after paper after learned paper in the peer-reviewed literature makes that quite plain. Idso cites some 150 scientific sources, nearly all of them providing hard evidence, by measurement and experiment, that there is no basis for imagining that we can acidify the oceans to any extent large enough to be measured even by the most sensitive instruments.' (Christopher Monckton)
Not all of the CO2 emitted by human industrial activities remains in the atmosphere. Between 25% and 50% of these emissions over the industrial period have been absorbed by the world’s oceans, preventing atmospheric CO2 buildup from being much, much worse.

But this atmospheric benefit comes at a considerable price.

As ocean waters absorb CO2 they become more acidic. This does not mean the oceans will become acid. Ocean life can be sensitive to slight changes in pH levels, and any drop in pH is an increase in acidity, even in an alkaline environment.

The acidity of global surface waters has increased by 30% in just the last 200 years. This rate of acidification is projected through the end of the century to accelerate even further with potentially catastrophic impacts to marine ecosystems.

Endorsed by seventy academies of science from around the world, a June 2009 statement from the InterAcademy Panel on International Issues (IAP) stated the following.
"The current rate of change is much more rapid than during any event over the last 65 million years. These changes in ocean chemistry are irreversible for many thousands of years, and the biological consequences could last much longer."

- The InterAcademy Panel, June 1, 2009

As surface waters become more acidic, it becomes more difficult for marine life like corals and shellfish to form the hard shells necessary for their survival, and coral reefs provide a home for more than 25% of all oceanic species. Tiny creatures called pteropods located at the base of many oceanic food chains can also be seriously impacted. The degradation of these species at the foundation of marine ecosystems could lead to the collapse of these environments with devastating implications to millions of people in the human populations that rely on them.

The IAP also stated that, if atmospheric CO2 were to reach 550 parts per million (ppm) along its current rapid ascent from its pre-industrial level of 280 ppm, coral reefs around the globe could be dissolving.

Oceanic species threatened by acidification


All original material is copyright of its author. Fair use permitted. Contact via comment. Unless indicated otherwise, all internet links accessed at time of writing. Nothing here should be taken as personal advice, financial or otherwise. No liability is accepted for third-party content, whether incorporated in or linked to this blog; or for unintentional error and inaccuracy. The blog author may have, or intend to change, a personal position in any stock or other kind of investment mentioned.

Can we escape?

Michael Snyder has written a good piece on waste ("About 40 Percent Of All Food In The United States Is Thrown In The Garbage", 1 October). But as one of his sources makes clear, something like that percentage starts as garbage:

The food I sell is not healthy, by any stretch. I sell potato chips, candy bars, bread, canned food, ice cream, soda, packaged meat, cigarettes and alcohol. I noticed quickly that a common ingredient of most of the foods is sugar and grains. Sugar and grains are easy to grow and produce cheaply and are used as fillers in processed food to cut cost and mask the taste of other questionable ingredients. Grains work in conjunction with sugars to inflame the body and compromise the immune system. Grains and sugars also have no nutritional value besides calories, so on top of inflaming the body; they do not provide the sustenance the body needs to survive. As the functions of the body require these nutrients the diet lacks, the body sucks these minerals from the bones, teeth and brain. Bone loss, and tooth decay and decreased brain function are the unfortunate symptoms of malnutrition. The poorest of the customers I serve are also the sickest. I have witnessed toothless mouths in the young and old. Mental retardation is also a common trait among many of them. I have even witnessed one unfortunate woman whose skin was a pale green color. These people are dying a slow starvation and they don’t even know it.

I think all this is connected to what Marxists call "reification", the process whereby a need or function becomes institutionalised and then the agenda is driven by that institution's instinct to survive and thrive. In this case, the manufacturer's need to widen profit margins by using cheap ingredients, and the supermarket's need to have products with a long shelf life, so skewing them towards sugar, salt and other preservatives.

Food, health, education, crime prevention, entertainment, government - almost all of it comes in somebody else's box.

The case for freedom is sometimes overstated. We give up a lot of freedom for an easy, comfortable life. But when the institutions become toxic, we begin to think like Huck Finn:

I reckon I got to light out for the territory ahead of the rest, because Aunt Sally she's going to adopt me and sivilize me, and I can't stand it. I been there before.

Even the wrapper is useful. Pic source.

All original material is copyright of its author. Fair use permitted. Contact via comment. Unless indicated otherwise, all internet links accessed at time of writing. Nothing here should be taken as personal advice, financial or otherwise. No liability is accepted for third-party content, whether incorporated in or linked to this blog; or for unintentional error and inaccuracy. The blog author may have, or intend to change, a personal position in any stock or other kind of investment mentioned.

Tuesday, October 01, 2013

Sunday in London

£2 to park all day at Solihull station, 102 minutes to Marylebone, then half an hour to South Kensington Tube station, where there's a feast of museums, and, like a trip through Gringotts' vaults, you go straight from the ticket barrier into the tiled tunnel that connects them.

The Victoria & Albert's  tea room is a sensual, secular temple - more stained glass, ceramic workman's mottos and erotic goddess-like sculpture than you can take in at one go. Someday we'll do lunch there - the hot food looks top quality - but this time coffee and a scone were enough. Then up to Level 6, passing some absorbing interactive displays in the wood furniture section and a richly ornamented virginal, to arrive at the ceramics rooms. Some things were familiar - De Morgan tiles, Wedgwood, the 1957 design Homemaker plates (we have a well-used couple), some deceptively modern - a tiny, vigorous vase in the shape of a ram's head that looked postwar but was classical Greek (400 - 300 BC), and the one that astonished me this time was a huge blue alien - an ancient Egyptian "was-sceptre" seven feet high and 3,500 years old:

V&A link
You can't read a library, so we broke off and went to the Natural History Museum. Sunday being sprog day, the place was packed with children seeking dinosaurs, and they were rewarded from the off:
 
Pic source
The architecture alone is worth a visit, built as though it takes a delight in itself and the staircases could move about as in Hogwarts. Sit by the loos and look through an archway into the main hall, catching the slant of a stair and a brick-pilastered gallery hinting at more space beyond, in the way great buildings have that make them seem bigger than the open air.

The mammal collection was full of things that were safely stuffed, as I suppose we are these days. Standing by hippos and polar bears, I thought if it's them or me there's no question. And the blue whale made the neighbouring elephant look undersized and vulnerable: just a good mouthful.

Undraped, the walls echo so that on a busy day you can't really follow the talking displays, and for a venue so attractive to the young there doesn't seem to be enough to engage them actively - unlike at Bristol Zoo, which has put a great deal of thought and imagination into making things for children to poke their heads or fold their bodies in, clamber on, push, turn, squirt (there's a telltale puddle by the lion's-backside board, but kids don't anticipate) and so on. Still, they'll have enjoyed their dinos. We shoved a fiver into the perspex donation box and left.

And on up the Brompton Road, past the gloriously-interiored Oratory to turn right into Beauchamp Place for the Maroush Bakehouse, one of a chain of Lebanese restaurants.

Baker Street, the Edgware Road, Knightsbridge, the Temple area - Lebanese is popping up everywhere. Delicate spicing, deliciously fresh salads, mint tea, Mediterranean-style coffee and shisha pipes in many places, the odd piece of hot charcoal falling off the tinfoil and scorching the tablecloth as the girls suck and giggle. Organic-shaped pots, jugs and lamps, arabesque music, modern Dubai-style consumerist TV, all good for an hour's worth of playing the Oriental.

This Maroush didn't play up to the hokum smokum, but the food was excellent. We went for the set meal for two and could have fed at least another person, while an Australian couple in sports gear ("size matters" said the stripe on his sweatpants) talked business strategy on the next table and their neighbours examined kid pictures on granny's boasting-iPhone. Anyway, stuffed again, but in a good way this time. They do breakfast too, and the bakery section does takeaway; we like.

And so to walk it off, passing Harrod's (open till 6 on Sunday and the Food Hall is another place of worship, packed with Arabs and Japanese) and Knightsbridge Tube Station (which may well have been built specifically to exit smack by the store). We cut left a couple of times to enter Hyde Park and head north across its expanse, crossing an earthen ride and skirting the Serpentine (where Shelley's wife drowned herself) to pause at Speaker's Corner. There, a black man in a police sergeant's jacket and jackboots was using an England flag as a pointer as he listed races that he alleged "they don't like"; his patter palled with repetition, so we walked on past various Christian evangelists and the horse's head sculpture that I thought was a reference to the 1982 bombings, but not necessarily so, through Marble Arch and across the road island - where banner-holding Egyptians were protesting to the traffic against the military government - to Marylebone, and home.

 
Pic source
All original material is copyright of its author. Fair use permitted. Contact via comment. Unless indicated otherwise, all internet links accessed at time of writing. Nothing here should be taken as personal advice, financial or otherwise. No liability is accepted for third-party content, whether incorporated in or linked to this blog; or for unintentional error and inaccuracy. The blog author may have, or intend to change, a personal position in any stock or other kind of investment mentioned.

John Cook's Climate Change Mythbusters 14

This is part of a series reposting material from John Cook's Skeptical Science website. Although he is a physicist rather than a specialist in climate science, he is a convinced "global warmist" and tries to rebut frequently-raised objections to the theory. However, it is always possible to question the data (e.g. this valuable note about measuring temperature) and the line of argument. Please help advance the debate - with facts and logic.
_______________________________________________________

Are we heading into a new Ice Age?

What The Science Says:
Worry about global warming impacts in the next 100 years, not an ice age in over 10,000 years.
Climate Myth: We're heading into an ice age
"One day you'll wake up - or you won't wake up, rather - buried beneath nine stories of snow. It's all part of a dependable, predictable cycle, a natural cycle that returns like clockwork every 11,500 years. And since the last ice age ended almost exactly 11,500 years ago…" (Ice Age Now)
According to ice cores from Antarctica, the past 400,000 years have been dominated by glacials, also known as ice ages, that last about 100,000. These glacials have been punctuated by interglacials, short warm periods which typically last 11,500 years. Figure 1 below shows how temperatures in Antarctica changed over this period. Because our current interglacial (the Holocene) has already lasted approximately 12,000 years, it has led some to claim that a new ice age is imminent. Is this a valid claim?


Figure 1: Temperature change at Vostok, Antarctica (Petit 2000). The timing of warmer interglacials is highlighted in green; our current interglacial, the Holocene, is the one on the far right of the graph.

To answer this question, it is necessary to understand what has caused the shifts between ice ages and interglacials during this period. The cycle appears to be a response to changes in the Earth’s orbit and tilt, which affect the amount of summer sunlight reaching the northern hemisphere. When this amount declines, the rate of summer melt declines and the ice sheets begin to grow. In turn, this increases the amount of sunlight reflected back into space, increasing (or amplifying) the cooling trend. Eventually a new ice age emerges and lasts for about 100,000 years.

So what are today’s conditions like? Changes in both the orbit and tilt of the Earth do indeed indicate that the Earth should be cooling. However, two reasons explain why an ice age is unlikely:
  1. These two factors, orbit and tilt, are weak and are not acting within the same timescale – they are out of phase by about 10,000 years. This means that their combined effect would probably be too weak to trigger an ice age. You have to go back 430,000 years to find an interglacial with similar conditions, and this interglacial lasted about 30,000 years.
  2. The warming effect from CO2 and other greenhouse gases is greater than the cooling effect expected from natural factors. Without human interference, the Earth’s orbit and tilt, a slight decline in solar output since the 1950s and volcanic activity would have led to global cooling. Yet global temperatures are definitely on the rise.
It can therefore be concluded that with CO2 concentrations set to continue to rise, a return to ice age conditions seems very unlikely. Instead, temperatures are increasing and this increase may come at a considerable cost with few or no benefits.

All original material is copyright of its author. Fair use permitted. Contact via comment. Unless indicated otherwise, all internet links accessed at time of writing. Nothing here should be taken as personal advice, financial or otherwise. No liability is accepted for third-party content, whether incorporated in or linked to this blog; or for unintentional error and inaccuracy. The blog author may have, or intend to change, a personal position in any stock or other kind of investment mentioned.

Monday, September 30, 2013

John Cook's Climate Change Mythbusters 13

This is part of a series reposting material from John Cook's Skeptical Science website. Although he is a physicist rather than a specialist in climate science, he is a convinced "global warmist" and tries to rebut frequently-raised objections to the theory. However, it is always possible to question the data (e.g. this valuable note about measuring temperature) and the line of argument. Please help advance the debate - with facts and logic.
_______________________________________________________

How sensitive is our climate?

What The Science Says:
Net positive feedback is confirmed by many different lines of evidence.
Climate Myth: Climate sensitivity is low
"His [Dr Spencer's] latest research demonstrates that – in the short term, at any rate – the temperature feedbacks that the IPCC imagines will greatly amplify any initial warming caused by CO2 are net-negative, attenuating the warming they are supposed to enhance. His best estimate is that the warming in response to a doubling of CO2 concentration, which may happen this century unless the usual suspects get away with shutting down the economies of the West, will be a harmless 1 Fahrenheit degree, not the 6 F predicted by the IPCC." (Christopher Monckton)
 Climate sensitivity is the estimate of how much the earth's climate will warm in response to the increased greenhouse effect if we double the amount of carbon dioxide in the atmosphere. This includes feedbacks which can either amplify or dampen that warming. This is very important because if it is low, as some climate 'skeptics' argue, then the planet will warm slowly and we will have more time to react and adapt. If sensitivity is high, then we could be in for a very bad time indeed.

There are two ways of working out what climate sensitivity is. The first method is by modelling:

 
Climate models have predicted the least temperature rise would be on average 1.65°C (2.97°F) , but upper estimates vary a lot, averaging 5.2°C (9.36°F). Current best estimates are for a rise of around 3°C (5.4°F), with a likely maximum of 4.5°C (8.1°F).
 
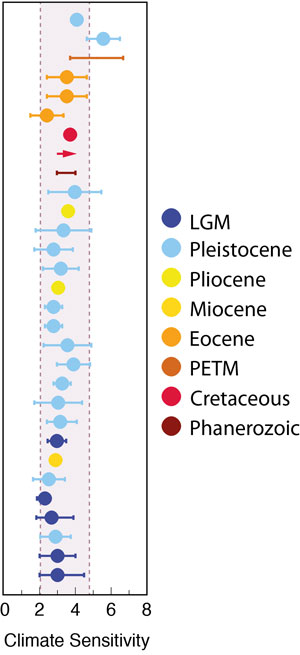
The second method calculates climate sensitivity directly from physical evidence, by looking at climate changes in the distant past:
 
adapted fig 3a

Various paleoclimate-based equilibrium climate sensitivity estimates from a range of geologic eras. Adapted from PALEOSENS (2012) Figure 3a by John Cook.
 
These calculations use data from sources like ice cores to work out how much additional heat the doubling of greenhouse gases will produce. These estimates are very consistent, finding between 2 and 4.5°C global surface warming in response to doubled carbon dioxide.

It’s all a matter of degree

All the models and evidence confirm a minimum warming close to 2°C for a doubling of atmospheric CO2 with a most likely value of 3°C and the potential to warm 4.5°C or even more. Even such a small rise would signal many damaging and highly disruptive changes to the environment. In this light, the arguments against reducing greenhouse gas emissions because of climate sensitivity are a form of gambling. A minority claim the climate is less sensitive than we think, the implication being we don’t need to do anything much about it. Others suggest that because we can't tell for sure, we should wait and see.
 
In truth, nobody knows for sure quite how much the temperature will rise, but rise it will. Inaction or complacency heightens risk, gambling with the entire ecology of the planet, and the welfare of everyone on it.
 
Basic rebuttal written by GPWayne.

All original material is copyright of its author. Fair use permitted. Contact via comment. Unless indicated otherwise, all internet links accessed at time of writing. Nothing here should be taken as personal advice, financial or otherwise. No liability is accepted for third-party content, whether incorporated in or linked to this blog; or for unintentional error and inaccuracy. The blog author may have, or intend to change, a personal position in any stock or other kind of investment mentioned.