Showing posts with label John Cook. Show all posts

Thursday, October 24, 2013

John Cook's Climate Change Mythbusters 20

This is part of a series reposting material from John Cook's Skeptical Science website. Although he is a physicist rather than a specialist in climate science, he is a convinced "global warmist" and tries to rebut frequently-raised objections to the theory. However, it is always possible to question the data (e.g. this valuable note about measuring temperature) and the line of argument. Please help advance the debate - with facts and logic.

Are glaciers growing or retreating?


What The Science Says:
Most glaciers are retreating, posing a serious problem for millions who rely on glaciers for water.
Climate Myth: Glaciers are growing
“[R]eports are coming in from all over the world: for the first time in over 250 years, glaciers in Alaska, Canada, New Zealand, Greenland, and now Norway are growing.”(JamulBlog)
Although Glaciologists measure year-to-year changes in glacier activity, it is the long term changes which provide the basis for statements such as "Global Glacier Recession Continues". Some Skeptics confuse these issues by cherry picking individual glaciers or by ignoring long term trends. Diversions such as these do not address the most important question of what is the real state of glaciers globally?

The answer is not only clear but it is definitive and based on the scientific literature. Globally glaciers are losing ice at an extensive rate (Figure 1). There are still situations in which glaciers gain or lose ice more than typical for one region or another but the long term trends are all the same, and about 90% of glaciers are shrinking worldwide (Figure 2).


Figure 1: Long-term changes in glacier volume adapted from Cogley 2009.
 
Figure 2: Percentage of shrinking and growing glaciers in 2008–2009, from the 2011 WGMS report
It is also very important to understand that glacier changes are not only dictated by air temperature changes but also by precipitation. Therefore, there are scenarios in which warming can lead to increases in precipitation (and thus glacier ice accumulation) such as displayed in part of southwestern Norway during the 1990s (Nesje et al 2008).

The bottom line is that glacier variations can be dependent on localized conditions but that these variations are superimposed on a clear and evident long term global reduction in glacier volume which has accelerated rapidly since the 1970s.

All original material is copyright of its author. Fair use permitted. Contact via comment. Unless indicated otherwise, all internet links accessed at time of writing. Nothing here should be taken as personal advice, financial or otherwise. No liability is accepted for third-party content, whether incorporated in or linked to this blog; or for unintentional error and inaccuracy. The blog author may have, or intend to change, a personal position in any stock or other kind of investment mentioned.

Wednesday, October 23, 2013

John Cook's Climate Change Mythbusters 19

This is part of a series reposting material from John Cook's Skeptical Science website. Although he is a physicist rather than a specialist in climate science, he is a convinced "global warmist" and tries to rebut frequently-raised objections to the theory. However, it is always possible to question the data (e.g. this valuable note about measuring temperature) and the line of argument. Please help advance the debate - with facts and logic.
Is Al Gore's An Inconvenient Truth accurate?
What The Science Says:
Al Gore's film was "broadly accurate" according to an expert witness called when an attempt was made through the courts to prevent the film being shown in schools.
Climate Myth: Al Gore got it wrong
“Al Gore's Oscar-winning documentary on global warming, An Inconvenient Truth, was […] criticised by a high court judge who highlighted what he said were "nine scientific errors" in the film.
Mr Justice Barton yesterday said that while the film was "broadly accurate" in its presentation of climate change, he identified nine significant errors in the film, some of which, he said, had arisen in "the context of alarmism and exaggeration" to support the former US vice-president's views on climate change.” (The Guardian)
Al Gore, certainly the most vilified proponent of climate change anywhere in the world, earned most of this enmity through the success of a film he presented called An Inconvenient Truth (AIT). The film was a staid presentation of climate science to date, a round-up of research, science and projections, with many cinematic sequences employed to harness the power of the medium.

The majority of the film, covering issues like Himalayan Glaciers, Greenland and Antarctica losing ice, the severity of hurricanes and other weather phenomena, was accurate and represented the science as it stood. Since the release of the film, considerably more evidence has been found in support of the science and projections in the film.

One claim was in error, as was one attribution of a graph. The error was in the claim that climate change had caused the shrinking of Mount Kilimanjaro, although the evidence that the shrinkage was most likely caused by deforestation did not appear until after the film was made. The error of attribution was in reference to a graph of temperature and attributes it mistakenly to a Dr. Thompson, when it was actually a combination of Mann’s hockey stick and CRU surface temperature data.

The Legal Case

The film is also subject to attack on the grounds that Al Gore was prosecuted in the UK and a judge found many errors in the film. This is untrue.

The case, heard in the civil court, was brought by a school governor against the Secretary of State for Education, in an attempt to prevent the film being distributed to schools. Mr. Justice Burton, in his judgement, ordered that teaching notes accompanying the film should be modified to clarify the speculative (and occasionally hyperbolic) presentation of some issues.

Mr. Justice Burton found no errors at all in the science. In his written judgement, the word error appears in quotes each time it is used – nine points formed the entirety of his judgement - indicating that he did not support the assertion the points were erroneous. About the film in general, he said this:

17. I turn to AIT, the film. The following is clear:

i) It is substantially founded upon scientific research and fact, albeit that the science is used, in the hands of a talented politician and communicator, to make a political statement and to support a political programme.

22. I have no doubt that Dr Stott, the Defendant's expert, is right when he says that:

"Al Gore's presentation of the causes and likely effects of climate change in the film was broadly accurate."

The judge did identify statements that had political implications he felt needed qualification in the guidance notes for teachers, and ordered that both qualifications on the science and the political implications should be included in the notes. Al Gore was not involved in the case, was not prosecuted, and because the trial was not a criminal case, there was no jury, and no guilty verdict was handed down.

Note: the vilification of Al Gore is best understood in the context of personalisation. When opponents attack something abstract - like science - the public may not associate with the argument. By giving a name and a face and a set of behavioural characteristics - being a rich politician, for example - it is easy to create a fictional enemy through inference and association. Al Gore is a successful politician who presented a film, his training and experience suitable to the task. To invoke Gore is a way to obfuscate about climate science, for which Gore has neither responsibility, claim nor blame.
 
Basic rebuttal written by GPWayne

All original material is copyright of its author. Fair use permitted. Contact via comment. Unless indicated otherwise, all internet links accessed at time of writing. Nothing here should be taken as personal advice, financial or otherwise. No liability is accepted for third-party content, whether incorporated in or linked to this blog; or for unintentional error and inaccuracy. The blog author may have, or intend to change, a personal position in any stock or other kind of investment mentioned.

Tuesday, October 22, 2013

John Cook's Climate Change Mythbusters 18

This is part of a series reposting material from John Cook's Skeptical Science website. Although he is a physicist rather than a specialist in climate science, he is a convinced "global warmist" and tries to rebut frequently-raised objections to the theory. However, it is always possible to question the data (e.g. this valuable note about measuring temperature) and the line of argument. Please help advance the debate - with facts and logic.

What is the link between hurricanes and global warming?
What The Science Says:
There is increasing evidence that hurricanes are getting stronger due to global warming.
Climate Myth: Hurricanes aren't linked to global warming
“According to the National Hurricane Center, storms are no more intense or frequent worldwide than they have been since 1850. […] Constant 24-7 media coverage of every significant storm worldwide just makes it seem that way.” (Paul Bedard)
The current research into the effects of climate change on tropical storms demonstrates not only the virtues and transparency of the scientific method at work, but rebuts the frequent suggestion that scientists fit their findings to a pre-determined agenda in support of climate change. In the case of storm frequency, there is no consensus and reputable scientists have two diametrically opposed theories about increasing frequencies of such events.

The background to these enquiries stems from a simple observation: extra heat in the air or the oceans is a form of energy, and storms are driven by such energy. What we do not know is whether we might see more storms as a result of extra energy or, as other researchers believe, the storms may grow more intense, but the number might actually diminish.

What do the records show? According to the Pew Centre, “Globally, there is an average of about 90 tropical storms a year”. The IPCC AR4 report (2007) says regarding global tropical storms: "There is no clear trend in the annual numbers [i.e. frequency] of tropical cyclones."

But this graph, also from the Pew Centre, shows a 40% increase in North Atlantic tropical storms over the historic maximum of the mid-1950, which at the time was considered extreme:


But while the numbers are not contested, their significance most certainly is. Another study considered how this information was being collected, and research suggested that the increase in reported storms was due to improved monitoring rather than more storms actually taking place.

And to cap it off, two recent peer-reviewed studies completely contradict each other. One paper predicts considerably more storms due to global warming. Another paper suggests the exact opposite – that there will be fewer storms in the future.

What can we conclude from these studies? About hurricane frequency – not much; the jury is out, as they say. About climate change, we can say that these differing approaches are the very stuff of good science, and the science clearly isn’t settled! It is also obvious that researchers are not shying away from refuting associations with climate change, so we can assume they don’t think their funding or salaries are jeopardised by research they believe fails to support the case for AGW. The scientific method is alive and well.

Never mind the frequency, feel the width

So far, all we’ve managed is to document here is what we don’t know for sure yet. But we do know there is extra energy in the system now, so could it have any other effects on tropical storms? Here, the science is far less equivocal, and there is a broad consensus that storms are increasing in strength, or severity. This attribute, called the Power Dissipation Index, measures the duration and intensity (wind speed) of storms, and research has found that since the mid-1970s, there has been an increase in the energy of storms.

Recent research has shown that we are experiencing more storms with higher wind speeds, and these storms will be more destructive, last longer and make landfall more frequently than in the past. Because this phenomenon is strongly associated with sea surface temperatures, it is reasonable to suggest a strong probability that the increase in storm intensity and climate change are linked.

Basic rebuttal written by GPWayne

All original material is copyright of its author. Fair use permitted. Contact via comment. Unless indicated otherwise, all internet links accessed at time of writing. Nothing here should be taken as personal advice, financial or otherwise. No liability is accepted for third-party content, whether incorporated in or linked to this blog; or for unintentional error and inaccuracy. The blog author may have, or intend to change, a personal position in any stock or other kind of investment mentioned.

Monday, October 07, 2013

John Cook's Climate Change Mythbusters 17

This is part of a series reposting material from John Cook's Skeptical Science website. Although he is a physicist rather than a specialist in climate science, he is a convinced "global warmist" and tries to rebut frequently-raised objections to the theory. However, it is always possible to question the data (e.g. this valuable note about measuring temperature) and the line of argument. Please help advance the debate - with facts and logic.

What do the 'Climategate' hacked CRU emails tell us?

What the science says...

Select a level...Intermediate Advanced
A number of independent investigations from different countries, universities and government bodies have investigated the stolen emails and found no evidence of wrong doing. Focusing on a few suggestive emails, taken out of context, merely serves to distract from the wealth of empirical evidence for man-made global warming.

Climate Myth...

Climategate CRU emails suggest conspiracy:
“[T]he 1079 emails and 72 documents seem indeed evidence of a scandal involving most of the most prominent scientists pushing the man-made warming theory - a scandal that is one of the greatest in modern science. […] emails suggesting conspiracy, collusion in exaggerating warming data, possibly illegal destruction of embarrassing information, organised resistance to disclosure, manipulation of data, private admissions of flaws in their public claims and much more.” (Andrew Bolt, Herald Sun)
In November 2009, the servers at the University of East Anglia in Britain were illegally hacked and emails were stolen. When a selection of emails between climate scientists were published on the internet, a few suggestive quotes were seized upon by many claiming global warming was all just a conspiracy. A number of independent enquiries have investigated the conduct of the scientists involved in the emails. All have cleared the scientists of any wrong doing:
  1. In February 2010, the Pennsylvania State University released an Inquiry Report that investigated any 'Climategate' emails involving Dr Michael Mann, a Professor of Penn State's Department of Meteorology. They found that "there exists no credible evidence that Dr. Mann had or has ever engaged in, or participated in, directly or indirectly, any actions with an intent to suppress or to falsify data". On "Mike's Nature trick", they concluded "The so-called “trick”1 was nothing more than a statistical method used to bring two or more different kinds of data sets together in a legitimate fashion by a technique that has been reviewed by a broad array of peers in the field."
  2. In March 2010, the UK government's House of Commons Science and Technology Committee published a report finding that the criticisms of the Climate Research Unit (CRU) were misplaced and that CRU’s "Professor Jones’s actions were in line with common practice in the climate science community".
  3. In April 2010, the University of East Anglia set up an international Scientific Assessment Panel, in consultation with the Royal Society and chaired by Professor Ron Oxburgh. The Report of the International Panel assessed the integrity of the research published by the CRU and found "no evidence of any deliberate scientific malpractice in any of the work of the Climatic Research Unit".
  4. In June 2010, the Pennsylvania State University published their Final Investigation Report, determining "there is no substance to the allegation against Dr. Michael E. Mann".
  5. In July 2010, the University of East Anglia published the Independent Climate Change Email Review report. They examined the emails to assess whether manipulation or suppression of data occurred and concluded that "The scientists’ rigor and honesty are not in doubt".
  6. In July 2010, the US Environmental Protection Agency investigated the emails and "found this was simply a candid discussion of scientists working through issues that arise in compiling and presenting large complex data sets."
  7. In September 2010, the UK Government responded to the House of Commons Science and Technology Committee report, chaired by Sir Muir Russell. On the issue of releasing data, they found "In the instance of the CRU, the scientists were not legally allowed to give out the data". On the issue of attempting to corrupt the peer-review process, they found "The evidence that we have seen does not suggest that Professor Jones was trying to subvert the peer review process. Academics should not be criticised for making informal comments on academic papers".
  8. In February 2011, the Department of Commerce Inspector General conducted an independent review of the emails and found "no evidence in the CRU emails that NOAA inappropriately manipulated data".
  9. In August 2011, the National Science Foundation concluded "Finding no research misconduct or other matter raised by the various regulations and laws discussed above, this case is closed".
Just as there are many independent lines of evidence that humans are causing global warming, similarly a number of independent investigations have found no evidence of falsification or conspiracy by climate scientists.

"Mike's Nature trick" and "hide the decline"

The most quoted email is from Phil Jones discussing paleo-data used to reconstruct past temperatures (emphasis mine):
"I've just completed Mike's Nature trick of adding in the real temps to each series for the last 20 years (ie from 1981 onwards) and from 1961 for Keith's to hide the decline."
"Mike's Nature trick" refers to a technique (aka "trick of the trade") used in a paper published in Nature by lead author Michael Mann (Mann 1998). The "trick" is the technique of plotting recent instrumental data along with the reconstructed data. This places recent global warming trends in the context of temperature changes over longer time scales.
 
The most common misconception regarding this email is the assumption that "decline" refers to declining temperatures. It actually refers to a decline in the reliability of tree rings to reflect temperatures after 1960. This is known as the "divergence problem" where tree ring proxies diverge from modern instrumental temperature records after 1960. The divergence problem is discussed in the peer reviewed literature as early as 1995, suggesting a change in the sensitivity of tree growth to temperature in recent decades (Briffa 1998). It is also examined more recently in Wilmking 2008 which explores techniques in eliminating the divergence problem. So when you look at Phil Jone's email in the context of the science discussed, it is not the schemings of a climate conspiracy but technical discussions of data handling techniques available in the peer reviewed literature. More on the hockey stick divergence problem...

Trenberth's "travesty we can't account for the lack of warming"

The second most cited email is from climate scientist and IPCC lead author Kevin Trenberth. The highlighted quote is this: "The fact is that we can't account for the lack of warming at the moment and it is a travesty that we can't." This has been most commonly interpreted (among skeptics) as climate scientists secretly admitting amongst themselves that global warming really has stopped. Trenberth is actually discussing a paper he'd recently published that discusses the planet's energy budget - how much net energy is flowing into our climate and where it's going (Trenberth 2009).
 
In Trenberth's paper, he discusses how we know the planet is continually heating due to increasing carbon dioxide. Nevertheless, surface temperature sometimes shows short term cooling periods. This is due to internal variability and Trenberth was lamenting that our observation systems can't comprehensively track all the energy flow through the climate system. More on Trenberth's travesty...

The full body of evidence for man-made global warming

An important point to realise is that the emails involve a handful of scientists discussing a few pieces of climate data. Even without this data, there is still an overwhelming and consistent body of evidence, painstakingly compiled by independent scientific teams from institutions across the world.
What do they find? The planet is steadily accumulating heat. When you add up all the heat building in the oceans, land and atmosphere plus the energy required to melt glaciers and ice sheets, the planet has been accumulating heat at a rate of 190,260 Gigawatts over the past 40 years (Murphy 2009). Considering a typical nuclear power plant has an output of 1 Gigawatt, imagine over 190,000 power plants pouring their energy output directly into heating our land and oceans, melting ice and warming the air.
 
This build-up of heat is causing ice loss across the globe, from the Arctic to the Antarctic. Both Greenland and Antarctica are losing ice at an accelerated rate (Velicogna 2009, ). Even East Antarctica, previously thought to be too cold and stable, is now losing ice mass (Chen 2009). Glacier shrinkage is accelerating. Arctic sea ice has fallen so sharply, observations exceed even the IPCC worst case scenario. The combination of warming oceans and melting ice has resulted in sea level rise tracking the upper limit of IPCC predictions.
 
Rising temperatures have impacted animal and plant species worldwide. The distribution of tree lines, plants and many species of animals are moving into cooler regions towards the poles. As the onset of spring is happening earlier each year, animal and plant species are responding to the shift in seasons. Scientists observe that frog breeding, bird nesting, flowering and migration patterns are all occurring earlier in the year (Parmeson 2003). There are many other physical signs of widespread warming. The height of the tropopause, a layer in our atmosphere, is rising (Santer 2003). Arctic permafrost, covering about 25% of Northern Hemisphere land, is warming and degrading (Walsh 2009). The tropical belt is widening (Seidel 2007). These results are all consistent with global warming.
 
What’s causing this heat build-up? Humans are emitting huge amounts of carbon dioxide into the atmosphere - 29 billion tonnes in 2009 (CDIAC). Greenhouse theory predicts that more carbon dioxide in the atmosphere will trap heat energy as it escapes out to space. What do we observe? Carbon dioxide absorbs heat at certain wavelengths. Satellites over the past 40 years find less heat escaping to space at these wavelengths (Harries 2001, Griggs 2004, Chen 2007). Where does the heat go? Surface measurements find more heat returning back to the Earth's surface (Philipona 2004). Tellingly, the increase occurs at those same carbon dioxide absorption wavelengths (Evans 2006). This is the human fingerprint in global warming.
 
There are multiple lines of empirical evidence that global warming is happening and human activity is the cause. A few suggestive emails may serve as a useful distraction for those wishing to avoid the physical realities of climate change. But they change nothing about our scientific understanding of humanity’s role in global warming.

Last updated on 18 March 2012 by dana1981. View Archives
Printable Version | Offline PDF Version | Link to this page Related Arguments
 
All original material is copyright of its author. Fair use permitted. Contact via comment. Unless indicated otherwise, all internet links accessed at time of writing. Nothing here should be taken as personal advice, financial or otherwise. No liability is accepted for third-party content, whether incorporated in or linked to this blog; or for unintentional error and inaccuracy. The blog author may have, or intend to change, a personal position in any stock or other kind of investment mentioned.

Thursday, October 03, 2013

John Cook's Climate Change Mythbusters 16

This is part of a series reposting material from John Cook's Skeptical Science website. Although he is a physicist rather than a specialist in climate science, he is a convinced "global warmist" and tries to rebut frequently-raised objections to the theory. However, it is always possible to question the data (e.g. this valuable note about measuring temperature) and the line of argument. Please help advance the debate - with facts and logic.
_______________________________________________________

What evidence is there for the hockey stick?

What The Science Says:
Since the hockey stick paper in 1998, there have been a number of proxy studies analysing a variety of different sources including corals, stalagmites, tree rings, boreholes and ice cores. They all confirm the original hockey stick conclusion: the 20th century is the warmest in the last 1000 years and that warming was most dramatic after 1920.
Climate Myth: Hockey stick is broken
“In 2003 Professor McKitrick teamed with a Canadian engineer, Steve McIntyre, in attempting to replicate the chart and finally debunked it as statistical nonsense. They revealed how the chart was derived from "collation errors, unjustified truncation or extrapolation of source data, obsolete data, incorrect principal component calculations, geographical mislocations and other serious defects" -- substantially affecting the temperature index.” (John McLaughlin)
The "hockey stick" describes a reconstruction of past temperature over the past 1000 to 2000 years using tree-rings, ice cores, coral and other records that act as proxies for temperature (Mann 1999). The reconstruction found that global temperature gradually cooled over the last 1000 years with a sharp upturn in the 20th Century. The principal result from the hockey stick is that global temperatures over the last few decades are the warmest in the last 1000 years.


Figure 1: Northern Hemisphere temperature changes estimated from various proxy records shown in blue (Mann 1999). Instrumental data shown in red. Note the large uncertainty (grey area) as you go further back in time.

A critique of the hockey stick was published in 2004 (McIntyre 2004), claiming the hockey stick shape was the inevitable result of the statistical method used (principal components analysis). They also claimed temperatures over the 15th Century were derived from one bristlecone pine proxy record. They concluded that the hockey stick shape was not statistically significant.

An independent assessment of Mann's hockey stick was conducted by the National Center for Atmospheric Research (Wahl 2007). They reconstructed temperatures employing a variety of statistical techniques (with and without principal components analysis). Their results found slightly different temperatures in the early 15th Century. However, they confirmed the principal results of the original hockey stick - that the warming trend and temperatures over the last few decades are unprecedented over at least the last 600 years.


Figure 2: Original hockey stick graph (blue - MBH1998) compared to Wahl & Ammann reconstruction (red). Instrumental record in black (Wahl 2007).

While many continue to fixate on Mann's early work on proxy records, the science of paleoclimatology has moved on. Since 1999, there have been many independent reconstructions of past temperatures, using a variety of proxy data and a number of different methodologies. All find the same result - that the last few decades are the hottest in the last 500 to 2000 years (depending on how far back the reconstruction goes). What are some of the proxies that are used to determine past temperature?

Changes in surface temperature send thermal waves underground, cooling or warming the subterranean rock. To track these changes, underground temperature measurements were examined from over 350 bore holes in North America, Europe, Southern Africa and Australia (Huang 2000). Borehole reconstructions aren't able to give short term variation, yielding only century-scale trends. What they find is that the 20th century is the warmest of the past five centuries with the strongest warming trend in 500 years.


Figure 3: Global surface temperature change over the last five centuries from boreholes (thick red line). Shading represents uncertainty. Blue line is a five year running average of HadCRUT global surface air temperature (Huang 2000).

Stalagmites (or speleothems) are formed from groundwater within underground caverns. As they're annually banded, the thickness of the layers can be used as climate proxies. A reconstruction of Northern Hemisphere temperature from stalagmites shows that while the uncertainty range (grey area) is significant, the temperature in the latter 20th Century exceeds the maximum estimate over the past 500 years (Smith 2006).


Figure 4: Northern Hemisphere annual temperature reconstruction from speleothem reconstructions shown with 2 standard error (shaded area) (Smith 2006).

Historical records of glacier length can be used as a proxy for temperature. As the number of monitored glaciers diminishes in the past, the uncertainty grows accordingly. Nevertheless, temperatures in recent decades exceed the uncertainty range over the past 400 years (Oerlemans 2005).


Figure 5: Global mean temperature calculated form glaciers. The red vertical lines indicate uncertainty.

Of course, these examples only go back around 500 years - this doesn't even cover the Medieval Warm Period. When you combine all the various proxies, including ice cores, coral, lake sediments, glaciers, boreholes & stalagmites, it's possible to reconstruct Northern Hemisphere temperatures without tree-ring proxies going back 1,300 years (Mann 2008). The result is that temperatures in recent decades exceed the maximum proxy estimate (including uncertainty range) for the past 1,300 years. When you include tree-ring data, the same result holds for the past 1,700 years.


Figure 6: Composite Northern Hemisphere land and land plus ocean temperature reconstructions and estimated 95% confidence intervals. Shown for comparison are published Northern Hemisphere reconstructions (Mann 2008).

Paleoclimatology draws upon a range of proxies and methodologies to calculate past temperatures. This allows independent confirmation of the basic hockey stick result: that the past few decades are the hottest in the past 1,300 years.

All original material is copyright of its author. Fair use permitted. Contact via comment. Unless indicated otherwise, all internet links accessed at time of writing. Nothing here should be taken as personal advice, financial or otherwise. No liability is accepted for third-party content, whether incorporated in or linked to this blog; or for unintentional error and inaccuracy. The blog author may have, or intend to change, a personal position in any stock or other kind of investment mentioned.

Wednesday, October 02, 2013

John Cook's Climate Change Mythbusters 15

This is part of a series reposting material from John Cook's Skeptical Science website. Although he is a physicist rather than a specialist in climate science, he is a convinced "global warmist" and tries to rebut frequently-raised objections to the theory. However, it is always possible to question the data (e.g. this valuable note about measuring temperature) and the line of argument. Please help advance the debate - with facts and logic.
_______________________________________________________

Ocean acidification: global warming's evil twin

What The Science Says:
Ocean acidification threatens entire marine food chains.
Climate Myth: Ocean acidification isn't serious
'Our harmless emissions of trifling quantities of carbon dioxide cannot possibly acidify the oceans. Paper after paper after learned paper in the peer-reviewed literature makes that quite plain. Idso cites some 150 scientific sources, nearly all of them providing hard evidence, by measurement and experiment, that there is no basis for imagining that we can acidify the oceans to any extent large enough to be measured even by the most sensitive instruments.' (Christopher Monckton)
Not all of the CO2 emitted by human industrial activities remains in the atmosphere. Between 25% and 50% of these emissions over the industrial period have been absorbed by the world’s oceans, preventing atmospheric CO2 buildup from being much, much worse.

But this atmospheric benefit comes at a considerable price.

As ocean waters absorb CO2 they become more acidic. This does not mean the oceans will become acid. Ocean life can be sensitive to slight changes in pH levels, and any drop in pH is an increase in acidity, even in an alkaline environment.

The acidity of global surface waters has increased by 30% in just the last 200 years. This rate of acidification is projected through the end of the century to accelerate even further with potentially catastrophic impacts to marine ecosystems.

Endorsed by seventy academies of science from around the world, a June 2009 statement from the InterAcademy Panel on International Issues (IAP) stated the following.
"The current rate of change is much more rapid than during any event over the last 65 million years. These changes in ocean chemistry are irreversible for many thousands of years, and the biological consequences could last much longer."

- The InterAcademy Panel, June 1, 2009

As surface waters become more acidic, it becomes more difficult for marine life like corals and shellfish to form the hard shells necessary for their survival, and coral reefs provide a home for more than 25% of all oceanic species. Tiny creatures called pteropods located at the base of many oceanic food chains can also be seriously impacted. The degradation of these species at the foundation of marine ecosystems could lead to the collapse of these environments with devastating implications to millions of people in the human populations that rely on them.

The IAP also stated that, if atmospheric CO2 were to reach 550 parts per million (ppm) along its current rapid ascent from its pre-industrial level of 280 ppm, coral reefs around the globe could be dissolving.

Oceanic species threatened by acidification


All original material is copyright of its author. Fair use permitted. Contact via comment. Unless indicated otherwise, all internet links accessed at time of writing. Nothing here should be taken as personal advice, financial or otherwise. No liability is accepted for third-party content, whether incorporated in or linked to this blog; or for unintentional error and inaccuracy. The blog author may have, or intend to change, a personal position in any stock or other kind of investment mentioned.

Tuesday, October 01, 2013

John Cook's Climate Change Mythbusters 14

This is part of a series reposting material from John Cook's Skeptical Science website. Although he is a physicist rather than a specialist in climate science, he is a convinced "global warmist" and tries to rebut frequently-raised objections to the theory. However, it is always possible to question the data (e.g. this valuable note about measuring temperature) and the line of argument. Please help advance the debate - with facts and logic.
_______________________________________________________

Are we heading into a new Ice Age?

What The Science Says:
Worry about global warming impacts in the next 100 years, not an ice age in over 10,000 years.
Climate Myth: We're heading into an ice age
"One day you'll wake up - or you won't wake up, rather - buried beneath nine stories of snow. It's all part of a dependable, predictable cycle, a natural cycle that returns like clockwork every 11,500 years. And since the last ice age ended almost exactly 11,500 years ago…" (Ice Age Now)
According to ice cores from Antarctica, the past 400,000 years have been dominated by glacials, also known as ice ages, that last about 100,000. These glacials have been punctuated by interglacials, short warm periods which typically last 11,500 years. Figure 1 below shows how temperatures in Antarctica changed over this period. Because our current interglacial (the Holocene) has already lasted approximately 12,000 years, it has led some to claim that a new ice age is imminent. Is this a valid claim?


Figure 1: Temperature change at Vostok, Antarctica (Petit 2000). The timing of warmer interglacials is highlighted in green; our current interglacial, the Holocene, is the one on the far right of the graph.

To answer this question, it is necessary to understand what has caused the shifts between ice ages and interglacials during this period. The cycle appears to be a response to changes in the Earth’s orbit and tilt, which affect the amount of summer sunlight reaching the northern hemisphere. When this amount declines, the rate of summer melt declines and the ice sheets begin to grow. In turn, this increases the amount of sunlight reflected back into space, increasing (or amplifying) the cooling trend. Eventually a new ice age emerges and lasts for about 100,000 years.

So what are today’s conditions like? Changes in both the orbit and tilt of the Earth do indeed indicate that the Earth should be cooling. However, two reasons explain why an ice age is unlikely:
  1. These two factors, orbit and tilt, are weak and are not acting within the same timescale – they are out of phase by about 10,000 years. This means that their combined effect would probably be too weak to trigger an ice age. You have to go back 430,000 years to find an interglacial with similar conditions, and this interglacial lasted about 30,000 years.
  2. The warming effect from CO2 and other greenhouse gases is greater than the cooling effect expected from natural factors. Without human interference, the Earth’s orbit and tilt, a slight decline in solar output since the 1950s and volcanic activity would have led to global cooling. Yet global temperatures are definitely on the rise.
It can therefore be concluded that with CO2 concentrations set to continue to rise, a return to ice age conditions seems very unlikely. Instead, temperatures are increasing and this increase may come at a considerable cost with few or no benefits.

All original material is copyright of its author. Fair use permitted. Contact via comment. Unless indicated otherwise, all internet links accessed at time of writing. Nothing here should be taken as personal advice, financial or otherwise. No liability is accepted for third-party content, whether incorporated in or linked to this blog; or for unintentional error and inaccuracy. The blog author may have, or intend to change, a personal position in any stock or other kind of investment mentioned.

Monday, September 30, 2013

John Cook's Climate Change Mythbusters 13

This is part of a series reposting material from John Cook's Skeptical Science website. Although he is a physicist rather than a specialist in climate science, he is a convinced "global warmist" and tries to rebut frequently-raised objections to the theory. However, it is always possible to question the data (e.g. this valuable note about measuring temperature) and the line of argument. Please help advance the debate - with facts and logic.
_______________________________________________________

How sensitive is our climate?

What The Science Says:
Net positive feedback is confirmed by many different lines of evidence.
Climate Myth: Climate sensitivity is low
"His [Dr Spencer's] latest research demonstrates that – in the short term, at any rate – the temperature feedbacks that the IPCC imagines will greatly amplify any initial warming caused by CO2 are net-negative, attenuating the warming they are supposed to enhance. His best estimate is that the warming in response to a doubling of CO2 concentration, which may happen this century unless the usual suspects get away with shutting down the economies of the West, will be a harmless 1 Fahrenheit degree, not the 6 F predicted by the IPCC." (Christopher Monckton)
 Climate sensitivity is the estimate of how much the earth's climate will warm in response to the increased greenhouse effect if we double the amount of carbon dioxide in the atmosphere. This includes feedbacks which can either amplify or dampen that warming. This is very important because if it is low, as some climate 'skeptics' argue, then the planet will warm slowly and we will have more time to react and adapt. If sensitivity is high, then we could be in for a very bad time indeed.

There are two ways of working out what climate sensitivity is. The first method is by modelling:

 
Climate models have predicted the least temperature rise would be on average 1.65°C (2.97°F) , but upper estimates vary a lot, averaging 5.2°C (9.36°F). Current best estimates are for a rise of around 3°C (5.4°F), with a likely maximum of 4.5°C (8.1°F).
 
The second method calculates climate sensitivity directly from physical evidence, by looking at climate changes in the distant past:
 
adapted fig 3a

Various paleoclimate-based equilibrium climate sensitivity estimates from a range of geologic eras. Adapted from PALEOSENS (2012) Figure 3a by John Cook.
 
These calculations use data from sources like ice cores to work out how much additional heat the doubling of greenhouse gases will produce. These estimates are very consistent, finding between 2 and 4.5°C global surface warming in response to doubled carbon dioxide.

It’s all a matter of degree

All the models and evidence confirm a minimum warming close to 2°C for a doubling of atmospheric CO2 with a most likely value of 3°C and the potential to warm 4.5°C or even more. Even such a small rise would signal many damaging and highly disruptive changes to the environment. In this light, the arguments against reducing greenhouse gas emissions because of climate sensitivity are a form of gambling. A minority claim the climate is less sensitive than we think, the implication being we don’t need to do anything much about it. Others suggest that because we can't tell for sure, we should wait and see.
 
In truth, nobody knows for sure quite how much the temperature will rise, but rise it will. Inaction or complacency heightens risk, gambling with the entire ecology of the planet, and the welfare of everyone on it.
 
Basic rebuttal written by GPWayne.

All original material is copyright of its author. Fair use permitted. Contact via comment. Unless indicated otherwise, all internet links accessed at time of writing. Nothing here should be taken as personal advice, financial or otherwise. No liability is accepted for third-party content, whether incorporated in or linked to this blog; or for unintentional error and inaccuracy. The blog author may have, or intend to change, a personal position in any stock or other kind of investment mentioned.

Sunday, September 29, 2013

John Cook's Climate Change Mythbusters 12

This is part of a series reposting material from John Cook's Skeptical Science website. Although he is a physicist rather than a specialist in climate science, he is a convinced "global warmist" and tries to rebut frequently-raised objections to the theory. However, it is always possible to question the data (e.g. this valuable note about measuring temperature) and the line of argument. Please help advance the debate - with facts and logic.
_______________________________________________________

CO2 lags temperature - what does it mean?

What The Science Says:
CO2 didn't initiate warming from past ice ages but it did amplify the warming. In fact, about 90% of the global warming followed the CO2 increase.
Climate Myth: CO2 lags temperature
"An article in Science magazine illustrated that a rise in carbon dioxide did not precede a rise in temperatures, but actually lagged behind temperature rises by 200 to 1000 years. A rise in carbon dioxide levels could not have caused a rise in temperature if it followed the temperature." (Joe Barton)
Earth’s climate has varied widely over its history, from ice ages characterised by large ice sheets covering many land areas, to warm periods with no ice at the poles. Several factors have affected past climate change, including solar variability, volcanic activity and changes in the composition of the atmosphere. Data from Antarctic ice cores reveals an interesting story for the past 400,000 years. During this period, CO2 and temperatures are closely correlated, which means they rise and fall together. However, based on Antarctic ice core data, changes in CO2 follow changes in temperatures by about 600 to 1000 years, as illustrated in Figure 1 below. This has led some to conclude that CO2 simply cannot be responsible for current global warming.
 
 
Figure 1: Vostok ice core records for carbon dioxide concentration and temperature change.
 
This statement does not tell the whole story. The initial changes in temperature during this period are explained by changes in the Earth’s orbit around the sun, which affects the amount of seasonal sunlight reaching the Earth’s surface. In the case of warming, the lag between temperature and CO2 is explained as follows: as ocean temperatures rise, oceans release CO2 into the atmosphere. In turn, this release amplifies the warming trend, leading to yet more CO2 being released. In other words, increasing CO2 levels become both the cause and effect of further warming. This positive feedback is necessary to trigger the shifts between glacials and interglacials as the effect of orbital changes is too weak to cause such variation. Additional positive feedbacks which play an important role in this process include other greenhouse gases, and changes in ice sheet cover and vegetation patterns.
 
A 2012 study by Shakun et al. looked at temperature changes 20,000 years ago (the last glacial-interglacial transition) from around the world and added more detail to our understanding of the CO2-temperature change relationship. They found that:
  • The Earth's orbital cycles trigger the initial warming (starting approximately 19,000 years ago), which is first reflected in the the Arctic.
  • This Arctic warming caused large amounts of ice to melt, causing large amounts of fresh water to flood into the oceans.
  • This influx of fresh water then disrupted the Atlantic Ocean circulation, in turn causing a seesawing of heat between the hemispheres. The Southern Hemisphere and its oceans warmed first, starting about 18,000 years ago.
  • The warming Southern Ocean then released CO2 into the atmosphere starting around 17,500 years ago, which in turn caused the entire planet to warm via the increased greenhouse effect.
Overall, about 90% of the global warming occurred after the CO2 increase (Figure 2).
 
Shakun Fig 2a

Figure 2: Average global temperature (blue), Antarctic temperature (red), and atmospheric CO2 concentration (yellow dots). Source.

All original material is copyright of its author. Fair use permitted. Contact via comment. Unless indicated otherwise, all internet links accessed at time of writing. Nothing here should be taken as personal advice, financial or otherwise. No liability is accepted for third-party content, whether incorporated in or linked to this blog; or for unintentional error and inaccuracy. The blog author may have, or intend to change, a personal position in any stock or other kind of investment mentioned.

Saturday, September 28, 2013

John Cook's Climate Change Mythbusters 11

This is part of a series reposting material from John Cook's Skeptical Science website. Although he is a physicist rather than a specialist in climate science, he is a convinced "global warmist" and tries to rebut frequently-raised objections to the theory. However, it is always possible to question the data (e.g. this valuable note about measuring temperature) and the line of argument. Please help advance the debate - with facts and logic.
_______________________________________________________

What were climate scientists predicting in the 1970s?

What The Science Says:
The vast majority of climate papers in the 1970s predicted warming.
Climate Myth: Ice age predicted in the 70s
"[M]any publications now claiming the world is on the brink of a global warming disaster said the same about an impending ice age – just 30 years ago. Several major ones, including The New York Times, Time magazine and Newsweek, have reported on three or even four different climate shifts since 1895." (Fire and Ice)
In the thirty years leading up to the 1970s, available temperature recordings suggested that there was a cooling trend. As a result some scientists suggested that the current inter-glacial period could rapidly draw to a close, which might result in the Earth plunging into a new ice age over the next few centuries. This idea could have been reinforced by the knowledge that the smog that climatologists call ‘aerosols’ – emitted by human activities into the atmosphere – also caused cooling. In fact, as temperature recording has improved in coverage, it’s become apparent that the cooling trend was most pronounced in northern land areas and that global temperature trends were in fact relatively steady during the period prior to 1970.

At the same time as some scientists were suggesting we might be facing another ice age, a greater number published contradicting studies. Their papers showed that the growing amount of greenhouse gasses that humans were putting into the atmosphere would cause much greater warming – warming that would a much greater influence on global temperature than any possible natural or human-caused cooling effects.

By 1980 the predictions about ice ages had ceased, due to the overwhelming evidence contained in an increasing number of reports that warned of global warming. Unfortunately, the small number of predictions of an ice age appeared to be much more interesting than those of global warming, so it was those sensational 'Ice Age' stories in the press that so many people tend to remember.


The fact is that around 1970 there were 6 times as many scientists predicting a warming rather than a cooling planet. Today, with 30+years more data to analyse, we've reached a clear scientific consensus: 97% of working climate scientists agree with the view that human beings are causing global warming.

All original material is copyright of its author. Fair use permitted. Contact via comment. Unless indicated otherwise, all internet links accessed at time of writing. Nothing here should be taken as personal advice, financial or otherwise. No liability is accepted for third-party content, whether incorporated in or linked to this blog; or for unintentional error and inaccuracy. The blog author may have, or intend to change, a personal position in any stock or other kind of investment mentioned.

Friday, September 27, 2013

John Cook's Climate Change Mythbusters 10

This is part of a series reposting material from John Cook's Skeptical Science website. Although he is a physicist rather than a specialist in climate science, he is a convinced "global warmist" and tries to rebut frequently-raised objections to the theory. However, it is always possible to question the data (e.g. this valuable note about measuring temperature) and the line of argument. Please help advance the debate - with facts and logic.
_______________________________________________________

Is Antarctica losing or gaining ice?

What The Science Says:
Satellites measure Antarctica is gaining sea ice but losing land ice at an accelerating rate which has implications for sea level rise.
Climate Myth: Antarctica is gaining ice
"[Ice] is expanding in much of Antarctica, contrary to the widespread public belief that global warming is melting the continental ice cap." (Greg Roberts, The Australian)
Skeptic arguments that Antarctica is gaining ice frequently hinge on an error of omission, namely ignoring the difference between land ice and sea ice.

In glaciology and particularly with respect to Antarctic ice, not all things are created equal. Let us consider the following differences. Antarctic land ice is the ice which has accumulated over thousands of years on the Antarctica landmass itself through snowfall. This land ice therefore is actually stored ocean water that once fell as precipitation. Sea ice in Antarctica is quite different as it is ice which forms in salt water primarily during the winter months. When land ice melts and flows into the oceans global sea levels rise on average; when sea ice melts sea levels do not change measurably.

In Antarctica, sea ice grows quite extensively during winter but nearly completely melts away during the summer (Figure 1). That is where the important difference between Antarctic and Arctic sea ice exists as much of the Arctic's sea ice lasts all the year round. During the winter months it increases and before decreasing during the summer months, but an ice cover does in fact remain in the North which includes quite a bit of ice from previous years (Figure 1). Essentially Arctic sea ice is more important for the earth's energy balance because when it increasingly melts, more sunlight is absorbed by the oceans whereas Antarctic sea ice normally melts each summer leaving the earth's energy balance largely unchanged.


Figure 1: Coverage of sea ice in both the Arctic (Top) and Antarctica (Bottom) for both summer minimums and winter maximums. Source: National Snow and Ice Data Center

One must also be careful how you interpret trends in Antarctic sea ice. Currently this ice is increasing overall and has been for years but is this the smoking gun against climate change? Not quite. Antarctic sea ice is gaining because of many different reasons but the most accepted recent explanations are listed below:

i) Ozone levels over Antarctica have dropped causing stratospheric cooling and increasing winds which lead to more areas of open water that can be frozen (Gillet 2003, Thompson 2002, Turner 2009).

and

ii) The Southern Ocean is freshening because of increased rain and snowfall as well as an increase in meltwater coming from the edges of Antarctica's land ice (Zhang 2007, Bintanga et al. 2013). Together, these change the composition of the different layers in the ocean there causing less mixing between warm and cold layers and thus less melted sea and coastal land ice.

All the sea ice talk aside, it is quite clear that really when it comes to Antarctic ice and sea levels, sea ice is not the most important thing to measure. In Antarctica, the largest and most important ice mass is the land ice of the West Antarctic and East Antarctic ice sheets.

Therefore, how is Antarctic land ice doing?

Shepherd et al. 2012

Figure 2: Estimates of total Antarctic land ice changes and approximate sea level contributions using a combination of different measurement techniques (Shepherd, 2012). Shaded areas represent the estimate uncertainty (1-sigma).

Estimates of recent changes in Antarctic land ice (Figure 2, bottom panel) show an increasing contribution to sea level with time, although not as fast a rate or acceleration as Greenland. Between 1992 and 2011, the Antarctic Ice Sheets overall lost 1350 giga-tonnes (Gt) or 1,350,000,000,000 tonnes into the oceans, at an average rate of 70 Gt per year (Gt/yr). Because a reduction in mass of 360 Gt/year represents an annual global-average sea level rise of 1 mm, these estimates equate to an increase in global-average sea levels by 0.19 mm/yr.

There is variation between regions within Antarctica (Figure 2, top panel), with the West Antarctic Ice Sheet and the Antarctic Peninsula Ice Sheet losing ice mass, and with an increasing rate. The East Antarctic Ice Sheet is growing slightly over this period but not enough to offset the other losses. There are of course uncertainties in the estimation methods but independent data from multiple measurement techniques (explained here) all show the same thing, Antarctica is losing land ice as a whole, and these losses are accelerating quickly.

All original material is copyright of its author. Fair use permitted. Contact via comment. Unless indicated otherwise, all internet links accessed at time of writing. Nothing here should be taken as personal advice, financial or otherwise. No liability is accepted for third-party content, whether incorporated in or linked to this blog; or for unintentional error and inaccuracy. The blog author may have, or intend to change, a personal position in any stock or other kind of investment mentioned.

Thursday, September 26, 2013

John Cook's Climate Change Mythbusters 9

This is part of a series reposting material from John Cook's Skeptical Science website. Although he is a physicist rather than a specialist in climate science, he is a convinced "global warmist" and tries to rebut frequently-raised objections to the theory. However, it is always possible to question the data (e.g. this valuable note about measuring temperature) and the line of argument. Please help advance the debate - with facts and logic.
_______________________________________________________

What has global warming done since 1998?

What The Science Says:
For global records, 2010 is the hottest year on record, tied with 2005.
Climate Myth: It hasn't warmed since 1998
For the years 1998-2005, temperature did not increase. This period coincides with society's continued pumping of more CO2 into the atmosphere. (Bob Carter)
No, it hasn't been cooling since 1998. Even if we ignore long term trends and just look at the record-breakers, that wasn't the hottest year ever. Different reports show that, overall, 2005 was hotter than 1998. What's more, globally, the hottest 12-month period ever recorded was from June 2009 to May 2010.
 
Though humans love record-breakers, they don't, on their own, tell us a much about trends -- and it's trends that matter when monitoring Climate Change. Trends only appear by looking at all the data, globally, and taking into account other variables -- like the effects of the El Nino ocean current or sunspot activity -- not by cherry-picking single points.
 
There's also a tendency for some people just to concentrate on air temperatures when there are other, more useful, indicators that can perhaps give us a better idea how rapidly the world is warming. Oceans for instance -- due to their immense size and heat storing capability (called 'thermal mass') -- tend to give a much more 'steady' indication of the warming that is happening. Here records show that the Earth has been warming at a steady rate before and since 1998 and there's no signs of it slowing any time soon.
 
Fig 1

Land, atmosphere, and ice heating (red), 0-700 meter ocean heat content (OHC) increase (light blue), 700-2,000 meter OHC increase (dark blue). From Nuccitelli et al. (2012).

All original material is copyright of its author. Fair use permitted. Contact via comment. Unless indicated otherwise, all internet links accessed at time of writing. Nothing here should be taken as personal advice, financial or otherwise. No liability is accepted for third-party content, whether incorporated in or linked to this blog; or for unintentional error and inaccuracy. The blog author may have, or intend to change, a personal position in any stock or other kind of investment mentioned.

Wednesday, September 25, 2013

John Cook's Climate Change Mythbusters 8

This is part of a series reposting material from John Cook's Skeptical Science website. Although he is a physicist rather than a specialist in climate science, he is a convinced "global warmist" and tries to rebut frequently-raised objections to the theory. However, it is always possible to question the data (e.g. this valuable note about measuring temperature) and the line of argument. Please help advance the debate - with facts and logic.
_______________________________________________________

Can animals and plants adapt to global warming?

What The Science Says:
A large number of ancient mass extinction events have been strongly linked to global climate change. Because current climate change is so rapid, the way species typically adapt (eg - migration) is, in most cases, simply not be possible. Global change is simply too pervasive and occurring too rapidly.
Climate Myth: Animals and plants can adapt
[C]orals, trees, birds, mammals, and butterflies are adapting well to the routine reality of changing climate." (source: Hudson Institute)
Humans are transforming the global environment. Great swathes of temperate forest in Europe, Asia and North America have been cleared over the past few centuries for agriculture, timber and urban development. Tropical forests are now on the front line. Human-assisted species invasions of pests, competitors and predators are rising exponentially, and over-exploitation of fisheries, and forest animals for bush meat, to the point of collapse, continues to be the rule rather than the exception.

Driving this has been a six-fold expansion of the human population since 1800 and a 50-fold increase in the size of the global economy. The great modern human enterprise was built on exploitation of the natural environment. Today, up to 83% of the Earth’s land area is under direct human influence and we entirely dominate 36% of the bioproductive surface. Up to half the world’s freshwater runoff is now captured for human use. More nitrogen is now converted into reactive forms by industry than all by all the planet’s natural processes and our industrial and agricultural processes are causing a continual build-up of long-lived greenhouse gases to levels unprecedented in at least the last 800,000 years and possibly much longer.

Clearly, this planet-wide domination by human society will have implications for biological diversity. Indeed, a recent review on the topic, the 2005 Millennium Ecosystem Assessment report (an environmental report of similar scale to the Intergovernmental Panel on Climate Change Assessment Reports), drew some bleak conclusions – 60% of the world’s ecosystems are now degraded and the extinction rate is now 100 to 1000 times higher than the “background” rate of long spans of geological time. For instance, a study I conducted in 2003 showed that up to 42% of species in the Southeast Asian region could be consigned to extinction by the year 2100 due to deforestation and habitat fragmentation alone.


Figure 1: Southeast Asian extinctions projected due to habitat loss (source: Sodhi, N. S., Koh, L. P., Brook, B. W. & Ng, P. K. L. 2004)

Given these existing pressures and upheavals, it is a reasonable question to ask whether global warming will make any further meaningful contribution to this mess. Some, such as the sceptics S. Fred Singer and Dennis Avery, see no danger at all, maintaining that a warmer planet will be beneficial for mankind and other species on the planet and that “corals, trees, birds, mammals, and butterflies are adapting well to the routine reality of changing climate”. Also, although climate change is a concern for conservation biologists, it is not the focus for most researchers (at present), largely I think because of the severity and immediacy of the damage caused by other threats.

Global warming to date has certainly affected species’ geographical distributional ranges and the timing of breeding, migration, flowering, and so on. But extrapolating these observed impacts to predictions of future extinction risk is challenging. The most well known study to date, by a team from the UK, estimated that 18 and 35% of plant and animal species will be committed to extinction by 2050 due to climate change. This study, which used a simple approach of estimating changes in species geographical ranges after fitting to current bioclimatic conditions, caused a flurry of debate. Some argued that it was overly optimistic or too uncertain because it left out most ecological detail, while others said it was possibly overly pessimistic, based on what we know from species responses and apparent resilience to previous climate change in the fossil record – see below.

A large number of ancient mass extinction events have indeed been strongly linked to global climate change, including the most sweeping die-off that ended the Palaeozoic Era, 250 million years ago and the somewhat less cataclysmic, but still damaging, Palaeocene–Eocene Thermal Maximum, 55 million years ago. Yet in the more recent past, during the Quaternary glacial cycles spanning the last million years, there were apparently few climate-related extinctions. This curious paradox of few ice age extinctions even has a name – it is called ‘the Quaternary Conundrum’.

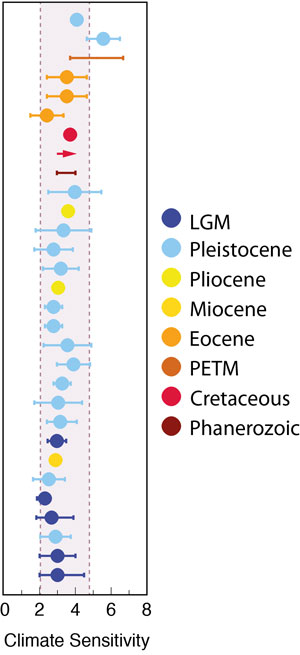
Over that time, the globally averaged temperature difference between the depth of an ice age and a warm interglacial period was 4 to 6°C – comparable to that predicted for the coming century due to anthropogenic global warming under the fossil-fuel-intensive, business-as-usual scenario. Most species appear to have persisted across these multiple glacial–interglacial cycles. This can be inferred from the fossil record, and from genetic evidence in modern species. In Europe and North America, populations shifted ranges southwards as the great northern hemisphere ice sheets advanced, and reinvaded northern realms when the glaciers retreated. Some species may have also persisted in locally favourable regions that were otherwise isolated within the tundra and ice-strewn landscapes. In Australia, a recently discovered cave site has shown that large-bodied mammals (‘megafauna’) were able to persist even in the arid landscape of the Nullarbor in conditions similar to now.

However, although the geological record is essential for understanding how species respond to natural climate change, there are a number of reasons why future impacts on biodiversity will be particularly severe:

A) Human-induced warming is already rapid and is expected to further accelerate. The IPCC storyline scenarios such as A1FI and A2 imply a rate of warming of 0.2 to 0.6°C per decade. By comparison, the average change from 15 to 7 thousand years ago was ~0.005°C per decade, although this was occasionally punctuated by short-lived (and possibly regional-scale) abrupt climatic jolts, such as the Younger Dryas, Dansgaard-Oeschger and Heinrich events.

B) A low-range optimistic estimate of 2°C of 21st century warming will shift the Earth’s global mean surface temperature into conditions which have not existed since the middle Pliocene, 3 million years ago. More than 4°C of atmospheric heating will take the planet’s climate back, within a century, to the largely ice-free world that existed prior to about 35 million years ago. The average ‘species’ lifetime’ is only 1 to 3 million years. So it is quite possible that in the comparative geological instant of a century, planetary conditions will be transformed to a state unlike anything that most of the world’s modern species have encountered.

C) As noted above, it is critical to understand that ecosystems in the 21st century start from an already massively ‘shifted baseline’ and so have lost resilience. Most habitats are already degraded and their populations depleted, to a lesser or greater extent, by past human activities. For millennia our impacts have been localised although often severe, but during the last few centuries we have unleashed physical and biological transformations on a global scale. In this context, synergies (positive or self-reinforcing feedbacks) from global warming, ocean acidification, habitat loss, habitat fragmentation, invasive species, chemical pollution (Figure 2) are likely lead to cascading extinctions. For instance, over-harvest, habitat loss and changed fire regimes will likely enhance the direct impacts of climate change and make it difficult for species to move to undamaged areas or to maintain a ‘buffer’ population size. One threat reinforces the other, or multiple impacts play off on each other, which makes the overall impact far greater than if each individual threats occurred in isolation (Brook et al 2008).


Figure 2: Figure from the Millennium Ecosystem Assessment

D) Past adaptation to climate change by species was mainly through shifting their geographic range to higher or lower latitudes (depending on whether the climate was warming or cooling), or up and down mountain slopes. There were also evolutionary responses – individuals that were most tolerant to new conditions survived and so made future generations more intrinsically resilient. Now, because of points A to C described above, this type of adaptation will, in most cases, simply not be possible or will be inadequate to cope. Global change is simply too pervasive and occurring too rapidly. Time’s up and there is nowhere for species to run or hide.

All original material is copyright of its author. Fair use permitted. Contact via comment. Unless indicated otherwise, all internet links accessed at time of writing. Nothing here should be taken as personal advice, financial or otherwise. No liability is accepted for third-party content, whether incorporated in or linked to this blog; or for unintentional error and inaccuracy. The blog author may have, or intend to change, a personal position in any stock or other kind of investment mentioned.