Monday, September 30, 2013

John Cook's Climate Change Mythbusters 13

This is part of a series reposting material from John Cook's Skeptical Science website. Although he is a physicist rather than a specialist in climate science, he is a convinced "global warmist" and tries to rebut frequently-raised objections to the theory. However, it is always possible to question the data (e.g. this valuable note about measuring temperature) and the line of argument. Please help advance the debate - with facts and logic.
_______________________________________________________

How sensitive is our climate?

What The Science Says:
Net positive feedback is confirmed by many different lines of evidence.
Climate Myth: Climate sensitivity is low
"His [Dr Spencer's] latest research demonstrates that – in the short term, at any rate – the temperature feedbacks that the IPCC imagines will greatly amplify any initial warming caused by CO2 are net-negative, attenuating the warming they are supposed to enhance. His best estimate is that the warming in response to a doubling of CO2 concentration, which may happen this century unless the usual suspects get away with shutting down the economies of the West, will be a harmless 1 Fahrenheit degree, not the 6 F predicted by the IPCC." (Christopher Monckton)
 Climate sensitivity is the estimate of how much the earth's climate will warm in response to the increased greenhouse effect if we double the amount of carbon dioxide in the atmosphere. This includes feedbacks which can either amplify or dampen that warming. This is very important because if it is low, as some climate 'skeptics' argue, then the planet will warm slowly and we will have more time to react and adapt. If sensitivity is high, then we could be in for a very bad time indeed.

There are two ways of working out what climate sensitivity is. The first method is by modelling:

 
Climate models have predicted the least temperature rise would be on average 1.65°C (2.97°F) , but upper estimates vary a lot, averaging 5.2°C (9.36°F). Current best estimates are for a rise of around 3°C (5.4°F), with a likely maximum of 4.5°C (8.1°F).
 
The second method calculates climate sensitivity directly from physical evidence, by looking at climate changes in the distant past:
 
adapted fig 3a

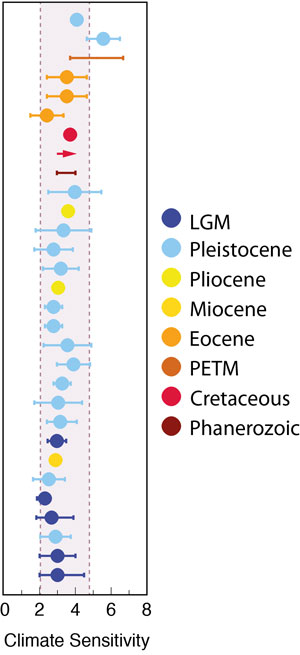
Various paleoclimate-based equilibrium climate sensitivity estimates from a range of geologic eras. Adapted from PALEOSENS (2012) Figure 3a by John Cook.
 
These calculations use data from sources like ice cores to work out how much additional heat the doubling of greenhouse gases will produce. These estimates are very consistent, finding between 2 and 4.5°C global surface warming in response to doubled carbon dioxide.

It’s all a matter of degree

All the models and evidence confirm a minimum warming close to 2°C for a doubling of atmospheric CO2 with a most likely value of 3°C and the potential to warm 4.5°C or even more. Even such a small rise would signal many damaging and highly disruptive changes to the environment. In this light, the arguments against reducing greenhouse gas emissions because of climate sensitivity are a form of gambling. A minority claim the climate is less sensitive than we think, the implication being we don’t need to do anything much about it. Others suggest that because we can't tell for sure, we should wait and see.
 
In truth, nobody knows for sure quite how much the temperature will rise, but rise it will. Inaction or complacency heightens risk, gambling with the entire ecology of the planet, and the welfare of everyone on it.
 
Basic rebuttal written by GPWayne.

All original material is copyright of its author. Fair use permitted. Contact via comment. Unless indicated otherwise, all internet links accessed at time of writing. Nothing here should be taken as personal advice, financial or otherwise. No liability is accepted for third-party content, whether incorporated in or linked to this blog; or for unintentional error and inaccuracy. The blog author may have, or intend to change, a personal position in any stock or other kind of investment mentioned.

Sunday, September 29, 2013

John Cook's Climate Change Mythbusters 12

This is part of a series reposting material from John Cook's Skeptical Science website. Although he is a physicist rather than a specialist in climate science, he is a convinced "global warmist" and tries to rebut frequently-raised objections to the theory. However, it is always possible to question the data (e.g. this valuable note about measuring temperature) and the line of argument. Please help advance the debate - with facts and logic.
_______________________________________________________

CO2 lags temperature - what does it mean?

What The Science Says:
CO2 didn't initiate warming from past ice ages but it did amplify the warming. In fact, about 90% of the global warming followed the CO2 increase.
Climate Myth: CO2 lags temperature
"An article in Science magazine illustrated that a rise in carbon dioxide did not precede a rise in temperatures, but actually lagged behind temperature rises by 200 to 1000 years. A rise in carbon dioxide levels could not have caused a rise in temperature if it followed the temperature." (Joe Barton)
Earth’s climate has varied widely over its history, from ice ages characterised by large ice sheets covering many land areas, to warm periods with no ice at the poles. Several factors have affected past climate change, including solar variability, volcanic activity and changes in the composition of the atmosphere. Data from Antarctic ice cores reveals an interesting story for the past 400,000 years. During this period, CO2 and temperatures are closely correlated, which means they rise and fall together. However, based on Antarctic ice core data, changes in CO2 follow changes in temperatures by about 600 to 1000 years, as illustrated in Figure 1 below. This has led some to conclude that CO2 simply cannot be responsible for current global warming.
 
 
Figure 1: Vostok ice core records for carbon dioxide concentration and temperature change.
 
This statement does not tell the whole story. The initial changes in temperature during this period are explained by changes in the Earth’s orbit around the sun, which affects the amount of seasonal sunlight reaching the Earth’s surface. In the case of warming, the lag between temperature and CO2 is explained as follows: as ocean temperatures rise, oceans release CO2 into the atmosphere. In turn, this release amplifies the warming trend, leading to yet more CO2 being released. In other words, increasing CO2 levels become both the cause and effect of further warming. This positive feedback is necessary to trigger the shifts between glacials and interglacials as the effect of orbital changes is too weak to cause such variation. Additional positive feedbacks which play an important role in this process include other greenhouse gases, and changes in ice sheet cover and vegetation patterns.
 
A 2012 study by Shakun et al. looked at temperature changes 20,000 years ago (the last glacial-interglacial transition) from around the world and added more detail to our understanding of the CO2-temperature change relationship. They found that:
  • The Earth's orbital cycles trigger the initial warming (starting approximately 19,000 years ago), which is first reflected in the the Arctic.
  • This Arctic warming caused large amounts of ice to melt, causing large amounts of fresh water to flood into the oceans.
  • This influx of fresh water then disrupted the Atlantic Ocean circulation, in turn causing a seesawing of heat between the hemispheres. The Southern Hemisphere and its oceans warmed first, starting about 18,000 years ago.
  • The warming Southern Ocean then released CO2 into the atmosphere starting around 17,500 years ago, which in turn caused the entire planet to warm via the increased greenhouse effect.
Overall, about 90% of the global warming occurred after the CO2 increase (Figure 2).
 
Shakun Fig 2a

Figure 2: Average global temperature (blue), Antarctic temperature (red), and atmospheric CO2 concentration (yellow dots). Source.

All original material is copyright of its author. Fair use permitted. Contact via comment. Unless indicated otherwise, all internet links accessed at time of writing. Nothing here should be taken as personal advice, financial or otherwise. No liability is accepted for third-party content, whether incorporated in or linked to this blog; or for unintentional error and inaccuracy. The blog author may have, or intend to change, a personal position in any stock or other kind of investment mentioned.

Saturday, September 28, 2013

Errors in the field

Some years ago I investigated errors generated by people collecting environmental data while out in the field. In those days we had computers and databases back at the lab, but field data was collected manually.

I’d written a range of error-trapping routines to pick up errors during data input at the lab so all I had to do was link errors to people. The survey included several hundred field workers and hundreds of thousands of items of data. These were not major errors by the way, but they had to be corrected.

Findings
I suppose I was most surprised at how many errors were being made and how consistent each person’s error rates were.

Firstly, line managers working in the field to keep their hand in. They tended to generate more errors than anyone else. Many should have been locked in their offices and never allowed into the field under any circumstances.

Secondly, there were a few people who were extremely meticulous, making a very small number of errors day in day out, but there were not many like that – maybe five or six at most.

Thirdly, there were people at the other end of the spectrum who routinely made a large number of errors.

So – not particularly surprising really, but what did strike me was the difference between the best and the worst. The worst field workers regularly made at least twenty times as many errors as the best.

Yet that did not mean that the worst couldn’t care less about the work – far from it as far as I could see. People doing environmental field work tend to be interested and conscientious.

I don’t know what became of the survey in the longer term, because I moved on. My reports were greeted with surprise and not a great deal of enthusiasm, but I always remember just how consistent people are when it comes to making mistakes in largely routine work.

All original material is copyright of its author. Fair use permitted. Contact via comment. Unless indicated otherwise, all internet links accessed at time of writing. Nothing here should be taken as personal advice, financial or otherwise. No liability is accepted for third-party content, whether incorporated in or linked to this blog; or for unintentional error and inaccuracy. The blog author may have, or intend to change, a personal position in any stock or other kind of investment mentioned.

Is democracy the answer to the EU?

Leaving the EU would not be the solution to our problems. It would expose the source of them, which is the news media and Parliament. If the former held up a reliable mirror to reality and the latter represented the views of the electorate, we would never have joined the Common Market in 1972.

As I said two years ago ("Voting reform: AV = First Past The Post", 11 April 2011), two-thirds of Members of Parliament got less than half the votes cast in their constituencies, in both the 2005 and 2010 General Elections. Once in Westminster, they have no binding obligation to represent our views and are subject to lobbying and appeals to personal ambition...

... and even less respectable forms of persuasion. For example, John Ward recently wrote how the Civil Service bends arms to serve The Machine:

The reason why there is no cross-Party consensus on the need to fire one bureaucrat in two remains as simple as ever. In the Tory Party, every Minister quickly realises that (often through mates in the security services) the Sir Humphrey with whom they’ve been blessed knows the location of every incriminating negative, and the nature of every peccadillo, related to that Minister of the Crown. When it comes to the Labour Party, Sir Humphrey’s underlings are all members of a trade union affiliated to the TUC. And in both Parties, senior civil servants know the Whips well enough to be able to gather further dirt on the Minister with whom they’ve been landed.

As to the media (who in the UK can be silenced by 'D' notices if they get too bothersome), Albert Burgess' essay on how we were persuaded to vote for entry into the Common Market shows who they work for:

But how to do it? First, organized breakfast meetings at the Connaught Hotel in London; these meetings were attended by Government Ministers, MPs, the British Council for the European Movement and top people from ITV, the BBC and the national newspapers. At these meetings the media people were persuaded to remove all their front line anti-EEC reporters and to replace them with pro-EEC reporters.
 
They set up a department in a back room of Chatham House where five people wrote thousands of letters all purporting to come from people like you and me, every letter saying what a great idea this EEC was; but the IRD did not have a facility to distribute them, so they were distributed to the central offices of the Conservative, Labour and Liberal parties and the British Council for the European Movement. They got them signed and sent to the letters pages of the news outlets. By this method they completely skewed the public’s perception of what was best for the Kingdom and themselves and their families.
 
The problem is not primarily the EU, and leaving it would only be the first of our challenges in setting up an open and wisely-run society.
 
Of these further challenges, one would be the people themselves, who under a democratic system are inclined to vote for more benefits than they have earned through work - or, in some cases, for more perceived good to others than can be realistically afforded. Harold Wilson saw Party advantage in youthful idealism and financial ignorance and reduced the voting age to 18; now, and for the same reasons, Ed Miliband proposes to lower it further, to 16.
 
I remember chairing a classroom debate on cruelty to animals. The 13-year-olds turned to the question of meat-eating, since it is not essential to human existence, and decided unanimously that it was wrong. When I asked how many of those present would now immediately cease to eat meat (even sausages, though whether they count is a moot question) the hands dropped.
 
And when the government is the demos, its undoing is the demagogue. The greatest orator of ancient times was Demosthenes, who swayed the voters of Athens to oppose Alexander, with bad results for many in the city and a completely disastrous one for its ally Thebes, which the conqueror razed to the ground. In our own time we've seen Britain make major mistakes thanks to the fey, guff-speaking fantasist Blair; mistakes that have killed hundreds of thousands of people in other countries.
 
Indeed, if we could correct these weaknesses in our politicians and our commentators and persuaders and in ourselves, we could probably remain in the EU without any problem.

All original material is copyright of its author. Fair use permitted. Contact via comment. Unless indicated otherwise, all internet links accessed at time of writing. Nothing here should be taken as personal advice, financial or otherwise. No liability is accepted for third-party content, whether incorporated in or linked to this blog; or for unintentional error and inaccuracy. The blog author may have, or intend to change, a personal position in any stock or other kind of investment mentioned.

The destitute professor: how America treats professionals in education

Buckle down, study hard, get qualifications, work hard and you'll get... nothing.


(CNN) -- "She was a professor?"

That's what an astonished caseworker at Adult Protective Services asked about Margaret Mary Vojtko when informed of the 83-year-old woman's destitute situation, according to an op-ed in the Pittsburgh Post-Gazette. Vojtko died September 1 of a massive heart attack.

Yes, she was a professor. An adjunct professor of French at Duquesne University. Until she was not renewed this year, with neither due process nor severance pay.

She taught students for 25 years, with no health benefits, no retirement benefits, and low wages.


(htp: Paddington.)

All original material is copyright of its author. Fair use permitted. Contact via comment. Unless indicated otherwise, all internet links accessed at time of writing. Nothing here should be taken as personal advice, financial or otherwise. No liability is accepted for third-party content, whether incorporated in or linked to this blog; or for unintentional error and inaccuracy. The blog author may have, or intend to change, a personal position in any stock or other kind of investment mentioned.

John Cook's Climate Change Mythbusters 11

This is part of a series reposting material from John Cook's Skeptical Science website. Although he is a physicist rather than a specialist in climate science, he is a convinced "global warmist" and tries to rebut frequently-raised objections to the theory. However, it is always possible to question the data (e.g. this valuable note about measuring temperature) and the line of argument. Please help advance the debate - with facts and logic.
_______________________________________________________

What were climate scientists predicting in the 1970s?

What The Science Says:
The vast majority of climate papers in the 1970s predicted warming.
Climate Myth: Ice age predicted in the 70s
"[M]any publications now claiming the world is on the brink of a global warming disaster said the same about an impending ice age – just 30 years ago. Several major ones, including The New York Times, Time magazine and Newsweek, have reported on three or even four different climate shifts since 1895." (Fire and Ice)
In the thirty years leading up to the 1970s, available temperature recordings suggested that there was a cooling trend. As a result some scientists suggested that the current inter-glacial period could rapidly draw to a close, which might result in the Earth plunging into a new ice age over the next few centuries. This idea could have been reinforced by the knowledge that the smog that climatologists call ‘aerosols’ – emitted by human activities into the atmosphere – also caused cooling. In fact, as temperature recording has improved in coverage, it’s become apparent that the cooling trend was most pronounced in northern land areas and that global temperature trends were in fact relatively steady during the period prior to 1970.

At the same time as some scientists were suggesting we might be facing another ice age, a greater number published contradicting studies. Their papers showed that the growing amount of greenhouse gasses that humans were putting into the atmosphere would cause much greater warming – warming that would a much greater influence on global temperature than any possible natural or human-caused cooling effects.

By 1980 the predictions about ice ages had ceased, due to the overwhelming evidence contained in an increasing number of reports that warned of global warming. Unfortunately, the small number of predictions of an ice age appeared to be much more interesting than those of global warming, so it was those sensational 'Ice Age' stories in the press that so many people tend to remember.


The fact is that around 1970 there were 6 times as many scientists predicting a warming rather than a cooling planet. Today, with 30+years more data to analyse, we've reached a clear scientific consensus: 97% of working climate scientists agree with the view that human beings are causing global warming.

All original material is copyright of its author. Fair use permitted. Contact via comment. Unless indicated otherwise, all internet links accessed at time of writing. Nothing here should be taken as personal advice, financial or otherwise. No liability is accepted for third-party content, whether incorporated in or linked to this blog; or for unintentional error and inaccuracy. The blog author may have, or intend to change, a personal position in any stock or other kind of investment mentioned.

Friday, September 27, 2013

John Cook's Climate Change Mythbusters 10

This is part of a series reposting material from John Cook's Skeptical Science website. Although he is a physicist rather than a specialist in climate science, he is a convinced "global warmist" and tries to rebut frequently-raised objections to the theory. However, it is always possible to question the data (e.g. this valuable note about measuring temperature) and the line of argument. Please help advance the debate - with facts and logic.
_______________________________________________________

Is Antarctica losing or gaining ice?

What The Science Says:
Satellites measure Antarctica is gaining sea ice but losing land ice at an accelerating rate which has implications for sea level rise.
Climate Myth: Antarctica is gaining ice
"[Ice] is expanding in much of Antarctica, contrary to the widespread public belief that global warming is melting the continental ice cap." (Greg Roberts, The Australian)
Skeptic arguments that Antarctica is gaining ice frequently hinge on an error of omission, namely ignoring the difference between land ice and sea ice.

In glaciology and particularly with respect to Antarctic ice, not all things are created equal. Let us consider the following differences. Antarctic land ice is the ice which has accumulated over thousands of years on the Antarctica landmass itself through snowfall. This land ice therefore is actually stored ocean water that once fell as precipitation. Sea ice in Antarctica is quite different as it is ice which forms in salt water primarily during the winter months. When land ice melts and flows into the oceans global sea levels rise on average; when sea ice melts sea levels do not change measurably.

In Antarctica, sea ice grows quite extensively during winter but nearly completely melts away during the summer (Figure 1). That is where the important difference between Antarctic and Arctic sea ice exists as much of the Arctic's sea ice lasts all the year round. During the winter months it increases and before decreasing during the summer months, but an ice cover does in fact remain in the North which includes quite a bit of ice from previous years (Figure 1). Essentially Arctic sea ice is more important for the earth's energy balance because when it increasingly melts, more sunlight is absorbed by the oceans whereas Antarctic sea ice normally melts each summer leaving the earth's energy balance largely unchanged.


Figure 1: Coverage of sea ice in both the Arctic (Top) and Antarctica (Bottom) for both summer minimums and winter maximums. Source: National Snow and Ice Data Center

One must also be careful how you interpret trends in Antarctic sea ice. Currently this ice is increasing overall and has been for years but is this the smoking gun against climate change? Not quite. Antarctic sea ice is gaining because of many different reasons but the most accepted recent explanations are listed below:

i) Ozone levels over Antarctica have dropped causing stratospheric cooling and increasing winds which lead to more areas of open water that can be frozen (Gillet 2003, Thompson 2002, Turner 2009).

and

ii) The Southern Ocean is freshening because of increased rain and snowfall as well as an increase in meltwater coming from the edges of Antarctica's land ice (Zhang 2007, Bintanga et al. 2013). Together, these change the composition of the different layers in the ocean there causing less mixing between warm and cold layers and thus less melted sea and coastal land ice.

All the sea ice talk aside, it is quite clear that really when it comes to Antarctic ice and sea levels, sea ice is not the most important thing to measure. In Antarctica, the largest and most important ice mass is the land ice of the West Antarctic and East Antarctic ice sheets.

Therefore, how is Antarctic land ice doing?

Shepherd et al. 2012

Figure 2: Estimates of total Antarctic land ice changes and approximate sea level contributions using a combination of different measurement techniques (Shepherd, 2012). Shaded areas represent the estimate uncertainty (1-sigma).

Estimates of recent changes in Antarctic land ice (Figure 2, bottom panel) show an increasing contribution to sea level with time, although not as fast a rate or acceleration as Greenland. Between 1992 and 2011, the Antarctic Ice Sheets overall lost 1350 giga-tonnes (Gt) or 1,350,000,000,000 tonnes into the oceans, at an average rate of 70 Gt per year (Gt/yr). Because a reduction in mass of 360 Gt/year represents an annual global-average sea level rise of 1 mm, these estimates equate to an increase in global-average sea levels by 0.19 mm/yr.

There is variation between regions within Antarctica (Figure 2, top panel), with the West Antarctic Ice Sheet and the Antarctic Peninsula Ice Sheet losing ice mass, and with an increasing rate. The East Antarctic Ice Sheet is growing slightly over this period but not enough to offset the other losses. There are of course uncertainties in the estimation methods but independent data from multiple measurement techniques (explained here) all show the same thing, Antarctica is losing land ice as a whole, and these losses are accelerating quickly.

All original material is copyright of its author. Fair use permitted. Contact via comment. Unless indicated otherwise, all internet links accessed at time of writing. Nothing here should be taken as personal advice, financial or otherwise. No liability is accepted for third-party content, whether incorporated in or linked to this blog; or for unintentional error and inaccuracy. The blog author may have, or intend to change, a personal position in any stock or other kind of investment mentioned.