Gary Dorsch points out that the UK bond market is a better indicator of local economic conditions than the UK stockmarket:
FTSE-100 companies equal about 85% of the market capitalization of the London Stock Exchange, and nearly half the companies are headquartered outside the UK. Roughly one-third of the FTSE is concentrated in the natural resource sector. Thus, the Footsie is viewed as a global bellwether rather than a reflection of the state of the British economy.
Right now the sharp downward trajectory of UK gilt yields is flashing warning signals of a sharp downturn in the British economy, which could trigger deflation in wages and UK home prices.
DISCLAIMER: Nothing here should be taken as personal advice, financial or otherwise. No liability is accepted for third-party content, whether incorporated in or linked to this blog.
Thursday, August 26, 2010
Wednesday, August 25, 2010
Time to invest in helium?
One for the commodity punters: the Daily Mail reports on the potential price boom in helium:
The world's biggest store of helium - the most commonly used inert gas - lies in a disused airfield in Amarillo, Texas, and is being sold off far too cheaply.
But in 1996, the US government passed a law which states that the facility - the US National Helium Reserve - must be completely sold off by 2015 to recoup the price of installing it.
This means that the helium, a non-renewable gas, is being quickly sold off at increasingly cheap prices, making it uneconomical to recycle [...] The US stores around 80 per cent of the world's helium and so its decision to let it go at an extremely low price has a massive knock-on effect on its market. [...] The only way to obtain more helium would be to capture it from the decay of tritium - a radioactive hydrogen isotope, which the U.S. stopped making in 1988.
The article says that because of the too-low price, it's being used very much faster than it can be replaced and reserves will be used up in 25 years. Professor Robert Richardson of Cornell University is arguing for a return to the free market in this commodity.
According to this site, major companies supplying helium in the US are Air Products (NYSE: APD) and Praxair (NYSE:PX).
Too exciting for me as an investor, and besides I don't know when in the next 25 years the market surge might start, if at all. But it's another story in the saga of finite world resources.
DISCLAIMER: Nothing here should be taken as personal advice, financial or otherwise. No liability is accepted for third-party content, whether incorporated in or linked to this blog.
Sunday, August 22, 2010
When will the bear market end? How bad will it get?
Tim W. Wood at Financial Sense reckons the last bull market ran from 1974 to 2007 (extended by government interference or support, depending on your point of view). His research tells him that bear markets last one-third as long as the preceding bull market, so he sees the present stockmarket rally as a "dead cat bounce".
That's my gut feeling, too, though I'm aware of the dangers of confirmation bias.
Below, I give two charts showing the course of the Dow from August 1929 (close to its pre-Crash peak) to August 2010, 82 years later. The first shows the raw index, which as you see only breached the 2,000 mark in the late 80s, making the last 20 years look freakish.

The second adjusts the Dow for inflation as measured by the CPI, so we can see where we are "in real terms" in comparison to the great speculative bull market of the late 1920s. Note that the recent low point (March 2009) is above the high point of the bull run that ended in January 1966, whereas the low of June 1982 was less than 40% of the 1929 peak.

If the eventual market bottom this time has the same relationship to the 1966 peak, as 1982 had to 1929, the Dow should go below 5,200 points (adjusted for inflation between now and the future low point).
So much has changed over the last 3 generations that the attempt to turn historical data into predictable cycles may be fruitless. On the one hand, debt is now an even greater burden than in 1929; on the other, big companies are multinational and the fortunes of Wall Street are less bound up with those of Main Street.
Yet global trade means that the fortunes of sovereign nations are increasingly interconnected, and while China is set to overtake Japan in size of economy, it is also (apparently) heading for a Western-style banking bust; should China choose to raid its overseas investments to tackle such a crisis, then the American markets (where China holds over $1 trillion of assets) are in trouble.
I still feel that a major breakdown is on the way, I just don't know exactly when. It's like waiting for the Big One in California: every day it's "not today", yet it's never "never".
DISCLAIMER: Nothing here should be taken as personal advice, financial or otherwise. No liability is accepted for third-party content, whether incorporated in or linked to this blog.
Saturday, August 21, 2010
Killer facts about the British standard of living
Average income in the UK is lower than in the Falkland Islands.
Iceland's per capita income is 14 rungs higher than ours.
Norwegians earn 2/3rds more than we do.
https://www.cia.gov/library/publications/the-world-factbook/rankorder/2004rank.html?countryName=Iceland&countryCode=ic®ionCode=eu&rank=20#ic
Iceland's per capita income is 14 rungs higher than ours.
Norwegians earn 2/3rds more than we do.
https://www.cia.gov/library/publications/the-world-factbook/rankorder/2004rank.html?countryName=Iceland&countryCode=ic®ionCode=eu&rank=20#ic
Gold, inflation and the Dow Jones Industrial Index
Republished from the Broad Oak Blog:
I give below two charts that look at how gold has fared since President Nixon de-linked it from the dollar in 1971. In inflation terms (as measured by the US CPI-U), gold now worth is almost twice as much as its long-term average; but in turn, the Dow is still running very high against gold.

I give below two charts that look at how gold has fared since President Nixon de-linked it from the dollar in 1971. In inflation terms (as measured by the US CPI-U), gold now worth is almost twice as much as its long-term average; but in turn, the Dow is still running very high against gold.
It may or may not be the case that gold is overpriced (perhaps we should be looking at inflation as measured by average earned income, or GDP, or something else) but either way, the Dow is still extraordinarily high. It does indeed look as though there was a "new paradigm" from the early 1990s; but perhaps a dangerously misleading one. Will gold double? Will the Dow halve?


DISCLAIMER: Nothing here should be taken as personal advice, financial or otherwise. No liability is accepted for third-party content, whether incorporated in or linked to this blog.
Gold, inflation and the Dow Jones Industrial Index
I give below two charts that look at how gold has fared since President Nixon de-linked it from the dollar in 1971. In inflation terms (as measured by the US CPI-U), gold now worth is almost twice as much as its long-term average; but in turn, the Dow is still running very high against gold.
It may or may not be the case that gold is overpriced (perhaps we should be looking at inflation as measured by average earned income, or GDP, or something else) but either way, the Dow is still extraordinarily high. It does indeed look as though there was a "new paradigm" from the early 1990s; but perhaps a dangerously misleading one. Will gold double? Will the Dow halve?
DISCLAIMER: Nothing here should be taken as personal advice, financial or otherwise. No liability is accepted for third-party content, whether incorporated in or linked to this blog.
Friday, August 20, 2010
Gold and Goldman Sachs
Republished from the Broad Oak Blog:
It appears that Goldman Sachs will simultaneously predict a rise in the value of gold, and a fall, depending on how valuable a client you are. Mind you, that could reflect the difference between the advice one gives to active traders as opposed to buy-and-holders, so it's not enough evidence to convict, I think.
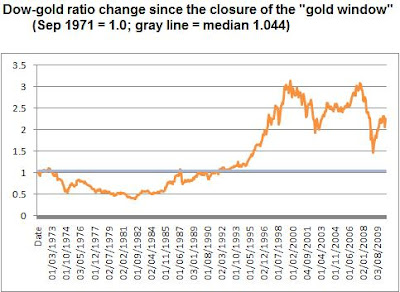
I looked at gold's longer-term price history in February of last year, starting in 1971 when President Nixon finally severed the official link between the US dollar and the precious metal on which it used to be based. Since then, and adjusted for the American Consumer Price Index, gold has averaged 2.8 or 2.9 times its September 1971 price. I reproduce the graph below:
It appears that Goldman Sachs will simultaneously predict a rise in the value of gold, and a fall, depending on how valuable a client you are. Mind you, that could reflect the difference between the advice one gives to active traders as opposed to buy-and-holders, so it's not enough evidence to convict, I think.
I looked at gold's longer-term price history in February of last year, starting in 1971 when President Nixon finally severed the official link between the US dollar and the precious metal on which it used to be based. Since then, and adjusted for the American Consumer Price Index, gold has averaged 2.8 or 2.9 times its September 1971 price. I reproduce the graph below:
 In September 1971, gold was trading at $42.02 per ounce, when the CPI index was at 40.8 . As I write, the New York spot price is $1,232.40 and July 2010's CPI figure is 218.011. So "in real terms" gold is now worth 5.49 times as much as in the autumn of 1971, i.e. nearly twice its long-term, inflation-adjusted trend.
As I've said before, we're now not looking at gold as a "good buy" because it's undervalued, which it isn't (it was, 10 years ago). Instead, it's assuming its role as a form of insurance against economic breakdown. I've noted recently, as doubtless you have too, how shops and internet sites have been springing up, offering to buy your gold. There must be a reason - though remember that these purchasers often don't give you the full melt-down value of your jewelry, so there's a profit margin for them already.
It may be a sign of the times, but that also means that it's a temporary phenomenon. Unless you're willing to keep a sharp eye out for price movements and can sell fairly quickly when you have made a gain, perhaps you should keep out of this speculative market.
Unless you believe the future is rather more catastrophic. In that case, as some are now advising, you may wish to build up your personal holding of the imperishable element. But consider the ancient buried hoards that have been discovered over the last few years by people with metal detectors: presumably those ancients thought they'd come back for their goods, but were overtaken by events. If you really have the disaster-movie outlook, maybe there are other, more useful things you should be doing to ensure that you survive and thrive.
Gold and Goldman Sachs
It appears that Goldman Sachs will simultaneously predict a rise in the value of gold, and a fall, depending on how valuable a client you are. Mind you, that could reflect the difference between the advice one gives to active traders as opposed to buy-and-holders, so it's not enough evidence to convict, I think.
I looked at gold's longer-term price history in February of last year, starting in 1971 when President Nixon finally severed the official link between the US dollar and the precious metal on which it used to be based. Since then, and adjusted for the American Consumer Price Index, gold has averaged 2.8 or 2.9 times its September 1971 price. I reproduce the graph below:
I looked at gold's longer-term price history in February of last year, starting in 1971 when President Nixon finally severed the official link between the US dollar and the precious metal on which it used to be based. Since then, and adjusted for the American Consumer Price Index, gold has averaged 2.8 or 2.9 times its September 1971 price. I reproduce the graph below:
In September 1971, gold was trading at $42.02 per ounce, when the CPI index was at 40.8 . As I write, the New York spot price is $1,232.40 and July 2010's CPI figure is 218.011. So "in real terms" gold is now worth 5.49 times as much as in the autumn of 1971, i.e. nearly twice its long-term, inflation-adjusted trend.
As I've said before, we're now not looking at gold as a "good buy" because it's undervalued, which it isn't (it was, 10 years ago). Instead, it's assuming its role as a form of insurance against economic breakdown. I've noted recently, as doubtless you have too, how shops and internet sites have been springing up, offering to buy your gold. There must be a reason - though remember that these purchasers often don't give you the full melt-down value of your jewelry, so there's a profit margin for them already.
It may be a sign of the times, but that also means that it's a temporary phenomenon. Unless you're willing to keep a sharp eye out for price movements and can sell fairly quickly when you have made a gain, perhaps you should keep out of this speculative market.
Unless you believe the future is rather more catastrophic. In that case, as some are now advising, you may wish to build up your personal holding of the imperishable element. But consider the ancient buried hoards that have been discovered over the last few years by people with metal detectors: presumably those ancients thought they'd come back for their goods, but were overtaken by events. If you really have the disaster-movie outlook, maybe there are other, more useful things you should be doing to ensure that you survive and thrive.
DISCLAIMER: Nothing here should be taken as personal advice, financial or otherwise. No liability is accepted for third-party content, whether incorporated in or linked to this blog.
Thursday, August 19, 2010
Beating inflation safely
Republished from the Broad Oak Blog:
UK investors who are concerned about the threat of inflation have recently (19 July) lost access to an ideal solution, the NS&I Index-Linked Savings Certificate. Now a building society is offering something to fill that gap in the market.
National Counties are marketing an index-linked cash ISA. This is not quite the same as NS&I's product, because the investment is for a fixed amount (the maximum cash ISA allowance, i.e. £5,100) and no withdrawals are permitted within the 5-year term of the plan. As with NS&I, the return is linked to the Retail Price Index (RPI), plus 1% p.a. For further comment by Citywire, see here.
A lot depends on what you think may happen in terms of inflation, which brings us to the great inflation-deflation debate. Some commentators are saying that Western economies are so indebted that we have reached a turning point and people will spend less and save more (or pay down debt, which amounts to the same thing). Governments are going to have to follow suit, and the UK government is currently busy trying to demonstrate its commitment to do so, fearing that bond markets may lose confidence in our financial management and will then charge higher interest, which would really put us in a pickle.
So demand is reducing. We see this in the recent bankruptcies of UK holiday companies and the pages of cut-price cruise adverts in the middle-class press. If this is the pattern generally, then holders of cash will benefit as prices reduce - the pound in your pocket will grow more valuable, quite safely. Even better, this type of deflationary gain is not taxed, at least not until the government nerves itself up to simply confiscate your savings.
But that's not the whole picture. While demand for luxuries is lessening, there are other things that we still have to buy, especially food and energy. Here, prices are rising. And if interest rates do rise, that will also increase RPI, which unlike the Consumer Price Index (CPI) includes housing costs. So it is quite possible that inflation as measured by RPI could be high, even as the economy slows down. It's worth noting that the government has recently changed rules on private sector occupational pensions so that their benefits will increase in line with CPI instead of RPI, which suggests that our rulers believe that one way or another, RPI will rise faster than CPI in years to come.
The BBC appears to have bought the official line that we should ignore food and energy costs, referring to CPI as "core" inflation and noting that it's now a mere 3.1%, as opposed to RPI which is running at 4.8%. However, unlike the mandarins at Broadcasting House, the rest of us need to eat and keep warm; or, to be a little fairer, food and energy is a more significant part of most people's budgets than it is for the upper echelon of the mediaocrities.
An RPI-linked cash product is a good each-way bet: if prices do reduce, then your money becomes more valuable; if prices increase, the value of your savings is preserved; and either way, you benefit from that extra 1% p.a. sweetener.
Reasons not to? You may find you need access to cash within the 5 year term; and if you're a gambler, you may be looking at investments that could outpace inflation (think of the current fever for commodities such as gold, silver, oil and agricultural products). But you shouldn't put all your eggs in one basket, and most ordinary people aren't gamblers when it comes to their nest-eggs, so this product is worth a look.
Beating inflation safely
UK investors who are concerned about the threat of inflation have recently (19 July) lost access to an ideal solution, the NS&I Index-Linked Savings Certificate. Now a building society is offering something to fill that gap in the market.
National Counties are marketing an index-linked cash ISA. This is not quite the same as NS&I's product, because the investment is for a fixed amount (the maximum cash ISA allowance, i.e. £5,100) and no withdrawals are permitted within the 5-year term of the plan. As with NS&I, the return is linked to the Retail Price Index (RPI), plus 1% p.a. For further comment by Citywire, see here.
A lot depends on what you think may happen in terms of inflation, which brings us to the great inflation-deflation debate. Some commentators are saying that Western economies are so indebted that we have reached a turning point and people will spend less and save more (or pay down debt, which amounts to the same thing). Governments are going to have to follow suit, and the UK government is currently busy trying to demonstrate its commitment to do so, fearing that bond markets may lose confidence in our financial management and will then charge higher interest, which would really put us in a pickle.
So demand is reducing. We see this in the recent bankruptcies of UK holiday companies and the pages of cut-price cruise adverts in the middle-class press. If this is the pattern generally, then holders of cash will benefit as prices reduce - the pound in your pocket will grow more valuable, quite safely. Even better, this type of deflationary gain is not taxed, at least not until the government nerves itself up to simply confiscate your savings.
But that's not the whole picture. While demand for luxuries is lessening, there are other things that we still have to buy, especially food and energy. Here, prices are rising. And if interest rates do rise, that will also increase RPI, which unlike the Consumer Price Index (CPI) includes housing costs. So it is quite possible that inflation as measured by RPI could be high, even as the economy slows down. It's worth noting that the government has recently changed rules on private sector occupational pensions so that their benefits will increase in line with CPI instead of RPI, which suggests that our rulers believe that one way or another, RPI will rise faster than CPI in years to come.
The BBC appears to have bought the official line that we should ignore food and energy costs, referring to CPI as "core" inflation and noting that it's now a mere 3.1%, as opposed to RPI which is running at 4.8%. However, unlike the mandarins at Broadcasting House, the rest of us need to eat and keep warm; or, to be a little fairer, food and energy is a more significant part of most people's budgets than it is for the upper echelon of the mediaocrities.
An RPI-linked cash product is a good each-way bet: if prices do reduce, then your money becomes more valuable; if prices increase, the value of your savings is preserved; and either way, you benefit from that extra 1% p.a. sweetener.
Reasons not to? You may find you need access to cash within the 5 year term; and if you're a gambler, you may be looking at investments that could outpace inflation (think of the current fever for commodities such as gold, silver, oil and agricultural products). But you shouldn't put all your eggs in one basket, and most ordinary people aren't gamblers when it comes to their nest-eggs, so this product is worth a look.
DISCLAIMER: Nothing here should be taken as personal advice, financial or otherwise. No liability is accepted for third-party content, whether incorporated in or linked to this blog.
Tuesday, August 17, 2010
Growing ownership by foreigners
Republished from the Broad Oak Blog:
One indication of our plight is the balance of ownership between ouselves and foreigners - who owns more (including official debt) of whom? The Econbrowser blog reproduces the following graph from a study of the US position:
 And I give below a graph I've constructed from official figures, showing what's happened here in the UK:
 For those inclined to blame solely New Labour for the economic disaster, this should be an eye-opener - look where we were in 1997.
Growing ownership by foreigners
One indication of our plight is the balance of ownership between ouselves and foreigners - who owns more (including official debt) of whom? The Econbrowser blog reproduces the following graph from a study of the US position:
And I give below a graph I've constructed from official figures, showing what's happened here in the UK:
For those inclined to blame solely New Labour for the economic disaster, this should be an eye-opener - look where we were in 1997.
DISCLAIMER: Nothing here should be taken as personal advice, financial or otherwise. No liability is accepted for third-party content, whether incorporated in or linked to this blog.
And I give below a graph I've constructed from official figures, showing what's happened here in the UK:For those inclined to blame solely New Labour for the economic disaster, this should be an eye-opener - look where we were in 1997.DISCLAIMER: Nothing here should be taken as personal advice, financial or otherwise. No liability is accepted for third-party content, whether incorporated in or linked to this blog.
Chinese spam
Recently, I've been getting short, apparently irrelevant comments in Chinese, often quoting proverbs. Is this a dry run for commercial spam campaigns, or probing for vulnerabilities in preparation for some system-wide serious cyberattack?
Sunday, August 15, 2010
Number crunching
Away for a week, but I read the papers, and on the same day they told me that (a) £5 bn pa is lost through fraud and error in social security payouts, and (b) UK banks have awarded £10 bn in bonuses this year. Which cheat-riddled benefits system should we reform first?

Friday, August 06, 2010
If you think positive thinking is annoying, you haven't considered negative thinking
Do you believe in Affirmations, also known as Cosmic Ordering, the Law of Attraction etc?
Believers in this New Age alleged horse-puckey:
Scott Adams (creator of Dilbert)
Noel Edmonds (what's the betting Rachel Cooke didn't rush off to try it herself? Surely it would disqualify you for working for the Guardian)
... and, I think, Richard Templar, author of bestseller "The Rules of Work". I suspect the most important thing he has to say is in the foreword, because that's where he reveals the formative experience. He was competing for a promotion against someone who was less qualified and capable, but the other man won. Templar discussed his disappointment with a colleague, who told him that it was because he didn't walk like a manager. Templar started looking and found that managers did indeed walk in a different way. When he fixed that for himself, promotion came.
I don't think it's essentially about conning other people, or about starting to con yourself (how can you do that and not know you're doing it?); I think it's about accepting that you may already be doing it, but in a negative way. If that is so, then the implications are challenging - and hopeful.
Wednesday, August 04, 2010
Is gold a safe haven?
I've looked at gold a number of times on Bearwatch, trying to see whether it's a protection against inflation and/or falls on the Dow Jones Index.
The trouble is, there's so much wealth in the world that the relatively small market in gold can be manipulated by speculators, so it doesn't compensate for inflation etc in a smooth way.
It is also, many suspect, manipulated by central banks and governments, in order to preserve the illusion that the economy is under control. Sharp rises in the price of gold are traditionally seen as a vote of no confidence in national economic management, especially paper money (the last official link between gold and the US dollar was broken in 1971).
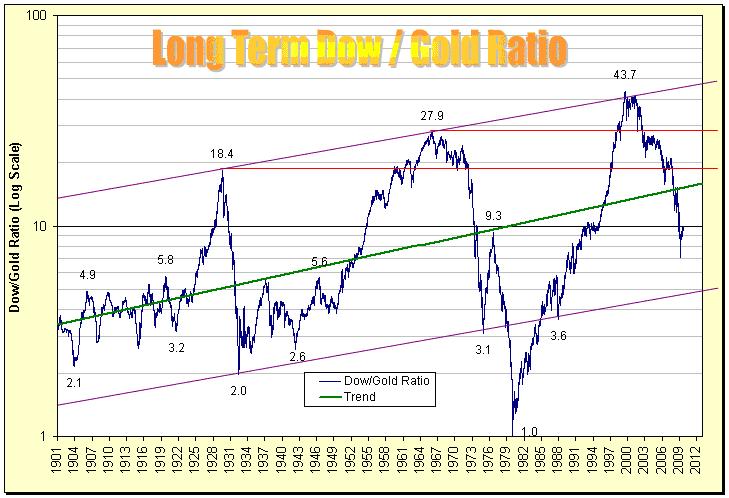
The graph below correlates gold and the Dow since the beginning of the 20th century. It's interesting because it shows how major crises impact on investment and gold.
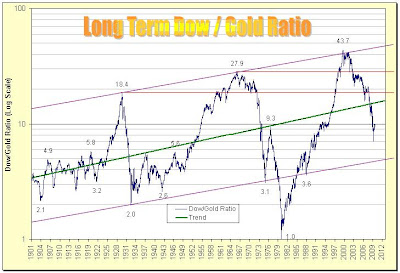
It's also interesting because it suggests some sort of cycle, and the logarithmic scale makes the peaks link up in a straight line. Less so the troughs - many "gold bugs" keep looking back to the panicky spike in the gold price in 1980, which was clearly very exceptional (though the gold bugs still hope it's a benchmark for the future).
Beware: the human mind is very good at perceiving patterns, and will force them onto random data, which is why people used to think they could see canals on Mars.
Having said that, note the green line on the graph, which indicates the long-term trend. In particular, note that the blue line is now well below it, though nowhere near previous troughs. This could mean that gold is overpriced, yet still in the zone where a "bigger fool" may come along and pay even more for it. Such is our vanity, we tend to think we'll never be the biggest fool, ourselves.
On the other hand, since this graph relates gold to the Dow, it could suggest that the Dow is underpriced, and I have been reading a number of commentators who expect a continuation of the recent recovery in the stockmarket, though this opinion is not universally shared.
The trouble is, there's so much wealth in the world that the relatively small market in gold can be manipulated by speculators, so it doesn't compensate for inflation etc in a smooth way.
It is also, many suspect, manipulated by central banks and governments, in order to preserve the illusion that the economy is under control. Sharp rises in the price of gold are traditionally seen as a vote of no confidence in national economic management, especially paper money (the last official link between gold and the US dollar was broken in 1971).
The graph below correlates gold and the Dow since the beginning of the 20th century. It's interesting because it shows how major crises impact on investment and gold.
It's also interesting because it suggests some sort of cycle, and the logarithmic scale makes the peaks link up in a straight line. Less so the troughs - many "gold bugs" keep looking back to the panicky spike in the gold price in 1980, which was clearly very exceptional (though the gold bugs still hope it's a benchmark for the future).
Beware: the human mind is very good at perceiving patterns, and will force them onto random data, which is why people used to think they could see canals on Mars.
Having said that, note the green line on the graph, which indicates the long-term trend. In particular, note that the blue line is now well below it, though nowhere near previous troughs. This could mean that gold is overpriced, yet still in the zone where a "bigger fool" may come along and pay even more for it. Such is our vanity, we tend to think we'll never be the biggest fool, ourselves.
On the other hand, since this graph relates gold to the Dow, it could suggest that the Dow is underpriced, and I have been reading a number of commentators who expect a continuation of the recent recovery in the stockmarket, though this opinion is not universally shared.
A further caveat: the graph looks as though it's a fairly regular cycle, but there are features of our present situation that are not cyclical, at least not in the usual few years/couple of decades frame. Some see the downwave of several longer-term cycles coming together in the not-too-distant future - here's an example from Charles Hugh Smith:

Here are some other reasons why the present recession (I believe it hasn't finished and has only been disguised by recent official financial intervention) may not be part of the "normal" business cycle:
- The ratio of total personal and public debt to GDP is the highest in modern history - higher even than just before the Great Crash of 1929
- There's been a social change in the West over the last generation or two, that has seen families become dependent on two earned incomes instead of one, so the option to earn more by sending one's partner out to work has already been exercised by many
- In developed and developing economies (e.g. China), the average age of the population is increasing. This means that more of the populace is looking to spend money on their needs (and older people need more healthcare), and fewer are in work and saving money
- National economies have become much more closely linked with one another. Many Western economies are in a similar, difficult financial situation and many Eastern economies have come to depend on trade with us, so that global fortunes are co-dependent in some ways. Investors may not be able to escape these problems by moving their money into other countries
- International trade has put highly-paid Western workers in much closer competition with workers in other countries where wage levels are far lower. Western wages per hour, already stagnant in real terms since somewhere in the 1970s, must (I believe) eventually come closer to Eastern pay rates; yet mortgages and other personal debts won't reduce just because the pay packet gets smaller
- Developed nations have set up expensive public systems of health treatment, education and social welfare benefits. It is going to be extremely hard to reduce these commitments in order to reduce taxation
Respected commentators like Mike Shedlock and Marc Faber (see yesterday) believe that the US, UK and other countries will not be able to square the circle. They differ only in how they think the disaster will play out.
In short, I would say that investing in gold is indeed a speculation, and to get into that market now appears to be coming a little late to the party, but if you share the wider outlook of many of the "bears" I've been following for the last 3 years, it may still be worth considering as an insurance against disaster. Perhaps we're at the point where we might even be prepared to accept a degree of loss on such a speculation, rather than lose far more if we remain in cash and see inflation destroy the value of money.
Investing in gold isn't the only precaution to consider. Look at what Faber says in the interview I posted yesterday - he's thinking in much bleaker terms and talks about buying agricultural land, moving out of the city etc. Faber isn't the only gloomy one: US Congressman Ron Paul is predicting social unrest when the government begins to fail on its commitments to citizens.
In short, the recent past is no guide to the future. Those graphs issued by investment funds and financial retail outlets, showing growth over 3 or 5 years (or whatever carefully-selected period makes their recommendation seem promising) are, in my opinion, pretty much useless. Whichever view you take, it is now important to make that a wider, longer view, because macroeconomic factors have become more significant.
And yes, the doomsters could also still be wrong, either about how things will go, or how soon, or both.
DISCLAIMER: Nothing here should be taken as personal advice, financial or otherwise. No liability is accepted for third-party content, whether incorporated in or linked to this blog.
Tuesday, August 03, 2010
Inflation or deflation? Crisis, either way.
Mike "Mish" Shedlock, financial analyst at Sitka Pacific, and Dr Marc Faber (Thailand-domiciled investment guru and economic commentator) are thought to represent opposite points of view - deflation versus inflation, respectively.
In this interview, it's clear that to some extent they agree: the US Government will see huge budget deficits for years to come, and it's not going to be a re-run of the 1970s: there is no ability of the people to take on more debt because (as Mish says) we've now gone from 1- to 2-wage households (where work is available).
Faber accepts that the government may eventually choose to default with respect to foreign creditors, but otherwise he sees monetary inflation to cover the public funding gap and stimulate economic demand. Mish sees price rises as compatible with his judgment that the economy will deflate.
DISCLAIMER: Nothing here should be taken as personal advice, financial or otherwise. No liability is accepted for third-party content, whether incorporated in or linked to this blog.
Too much wealth tied up in houses
Republished from the Broad Oak Blog:
A release from the Office for National Statistics, widely reported in the papers today, says that the UK's net worth is £6,669 billion. Of this, 61% (£4,048 billion) is tied up in housing.
According to Credit Action in April 2010, 11.1 million households have mortgages, at an average of £111, 612 per mortgage. The total of personal debt in the UK (including mortgages) is £1,464 billion; UK GDP in 2009 was an estimated £1,396 billion.
Much of the value of housing depends on the inflationary effect of lending. According to a release by the Council of Mortgage Lenders, in May 2010 the average loan to value for first-time buyers was 75%, and for house movers it was not much less (67%).
Housing has become a far more important element in our economy, over the last 50 years. Here is Table 1 of a press release by the Halifax in May 2010:
 Since 1959, total net household wealth has increased 5 times in real terms. But houses have gone up in value 11 times, and mortages are 23 times bigger. Consumer credit is also 13 times greater.
I don't think we can really run a successful economy on the basis of inflating the value of our huts by getting into hock with moneylenders. Sooner or later, we have to get out there and hunt something.
Too much wealth tied up in houses
A release from the Office for National Statistics, widely reported in the papers today, says that the UK's net worth is £6,669 billion. Of this, 61% (£4,048 billion) is tied up in housing.
According to Credit Action in April 2010, 11.1 million households have mortgages, at an average of £111, 612 per mortgage. The total of personal debt in the UK (including mortgages) is £1,464 billion; UK GDP in 2009 was an estimated £1,396 billion.
Much of the value of housing depends on the inflationary effect of lending. According to a release by the Council of Mortgage Lenders, in May 2010 the average loan to value for first-time buyers was 75%, and for house movers it was not much less (67%).
Housing has become a far more important element in our economy, over the last 50 years. Here is Table 1 of a press release by the Halifax in May 2010:
Since 1959, total net household wealth has increased 5 times in real terms. But houses have gone up in value 11 times, and mortages are 23 times bigger. Consumer credit is also 13 times greater.
According to Credit Action in April 2010, 11.1 million households have mortgages, at an average of £111, 612 per mortgage. The total of personal debt in the UK (including mortgages) is £1,464 billion; UK GDP in 2009 was an estimated £1,396 billion.
Much of the value of housing depends on the inflationary effect of lending. According to a release by the Council of Mortgage Lenders, in May 2010 the average loan to value for first-time buyers was 75%, and for house movers it was not much less (67%).
Housing has become a far more important element in our economy, over the last 50 years. Here is Table 1 of a press release by the Halifax in May 2010:
Since 1959, total net household wealth has increased 5 times in real terms. But houses have gone up in value 11 times, and mortages are 23 times bigger. Consumer credit is also 13 times greater.I don't think we can really run a successful economy on the basis of inflating the value of our huts by getting into hock with moneylenders. Sooner or later, we have to get out there and hunt something.
DISCLAIMER: Nothing here should be taken as personal advice, financial or otherwise. No liability is accepted for third-party content, whether incorporated in or linked to this blog.
Subscribe to:
Posts (Atom)